I have a question about matching four of the same drivers in one box [here, a vertical array]. The system they are going in is exotically expensive.
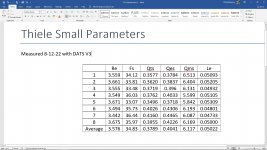
I purchased eight SATORI 6.5" MW16TX-4 TeXtreme drivers and measured the T-S parameters for each.
They of course are not matched perfectly from the dealer.
Look at the data and see if you can create a working theory for their matching.
I originally considered that Fs would be the deciding factor but when Fs is close, another parameter is not [e.g., Qts].
I plan to put four drivers in one box [two boxes for stereo of course] but I want to match them up to get the best matched performance from both boxes.
I've even created a speadsheet plotting all parameters against an average [including standard deviation] and still nothing obvious leaps out of the data.
One could just arbitrarily stick drivers 1-4 in box A and 5-8 in box B, but I'd like to take some time and use logic to match them better than just by chance.
So, what would YOU do to match these drivers and get balanced sound from both?
Pic of the measured Data for each of the eight drivers PLUS the parameter average is attached.
Attachments
Last edited:
First check them in box.. it may be possible the difference is less than it seems on the bench due to the way the parameters come together.
After that you do what you have to do. If I measure a slight difference in my amp channels I could use it to offset a slight speaker channel difference. Otherwise, do your own EQ.
After that you do what you have to do. If I measure a slight difference in my amp channels I could use it to offset a slight speaker channel difference. Otherwise, do your own EQ.

I through about this fact influencing these measurements. I'll do this for a few days and see what changes. Hopefully, things will loosen up favorably.Also break then in for a while, and retest.
But how would you match them? What data would you choose?First check them in box.. it may be possible the difference is less than it seems on the bench due to the way the parameters come together.
After that you do what you have to do. If I measure a slight difference in my amp channels I could use it to offset a slight speaker channel difference. Otherwise, do your own EQ.
For low frequency matching, take nearfield measurements on the woofers. Put the mic close to the dustcap.
The mismatch is pretty close to nothing.
As mentioned put driver 1-4 in box A
then 5-8 in box B
then operate for many hours.
As mentioned put driver 1-4 in box A
then 5-8 in box B
then operate for many hours.
I would focus on getting Fs close for each set after break in more than anything else since they're in the same box (and air space?).
It will depend on how they're wired jn the system to mate them in pairs, series and parallel. I would parallel the ones not so close and sires the ones closer to each other.
It will depend on how they're wired jn the system to mate them in pairs, series and parallel. I would parallel the ones not so close and sires the ones closer to each other.
50Hz-250Hzhow many octave you plan per driver?
what is mms of that driver?
12.6g
Have not measured that yet. Will do so after break-in.Your data does no show the sensitivity, that is quite important.
dave
In drag racing, one may compare what I am trying to do is top-fuel. What you are suggesting is pro-stock. Close enough is not the precision I am seeking but thanks for the suggestion.The level of precision required for audio isn't that high - they're close enough as is
Right, historically, of the manufacturers I've queried and noting the pioneers only published Fs, the standard at least in the USA for Quality Assurance (QA) has been +/- 10% efficiency (n0) and at a glance these driver's meet it since Fs dominates.Your data does no show the sensitivity, that is quite important.
n0 = (9.7822^10^10*Vas*Fs^3)/Qes
Burned in the drivers for about 72 hours varying the frequency on my function generator about every 6 hours, mostly near but above Fs. Ran them for the last 12 hours at 28Hz. Here's the results. Based on driver averages, calculated Vb=101.4L for 4 drivers per box [i.e., 4x the single-driver Vb].
What drivers would you put in each box and why?

What drivers would you put in each box and why?
Last edited:
I don't think I would use any of those. I would build a test box for a single driver, measure the frequency and impedance responses for each driver and then match them up so the average responses for sets of 4 were as close as possible for both variables.
Given the different Re, I would be more concerned with higher frequencies matching well - and best reflecting an "average" driver. Marginal differences at low frequencies, or even below the room's Schroeder frequency, isn't as big an issue IMO than making sure the responses are the same at higher frequencies where they cross to the next driver and the ear is sensitive.
You folks have given me much to think about. I appreciate them since it helps me think out of the box [pun intended]. I think I'll build a small box and run the T-S params again. For this would you build a box whose Vb > Vas?
BTW T-S params were measured free air with drivers hanging from a wire 57% above the floor and 43% below the ceiling. But for now, here's what the matchup looks like.
I ran some analysis based on matching various T-S parameters. Comments from this data?

BTW T-S params were measured free air with drivers hanging from a wire 57% above the floor and 43% below the ceiling. But for now, here's what the matchup looks like.
I ran some analysis based on matching various T-S parameters. Comments from this data?
In your shoes I'd choose a single box size, maybe something around 12l, and sim them all and overlay the results to see the spread.
- Home
- Loudspeakers
- Multi-Way
- Multiple-driver matching