Your first plot appears to show that extracted inductance is constant and independent of frequency, when you get about 1.5 decades or 2 decades above the self resonant frequency, namely, above 0.4 to 1.0 Megahertz. Which is good news since all of the measurements taken in post#1 were at frequencies between 8 MHz and 13 MHz -- where the inductance is constant. See Figure 5, column B (data table). No distributed inductance booger-men in your data.
Q gets better and better when frequency rises, because Z(inductor) gets bigger and bigger, while Z(esr) does not.
Q gets better and better when frequency rises, because Z(inductor) gets bigger and bigger, while Z(esr) does not.
Jack, would you know the specified ESR levels for those caps, and if you got a low frequency capacitance measurement for each DUT?For curiousity's sake, here are 3 1,000uF caps on the VNA impedance bridge.
For fun, calculate (or simulate) the maximum possible ESR at which the resonant RLC oscillator in post #1 will still barely oscillate. If you assume that sustained oscillation requires something like (Q >= 2.5) I don't think you'll be wildly inaccurate.
Now estimate the ESR of the capacitor shown in post #10. Should we expect this capacitor to produce oscillations in the post #1 circuit? Why or why not?
Now estimate the ESR of the capacitor shown in post #10. Should we expect this capacitor to produce oscillations in the post #1 circuit? Why or why not?
Jack, would you know the specified ESR levels for those caps, and if you got a low frequency capacitance measurement for each DUT?
I had to re-run the calibration and re-run the test:
Attachments
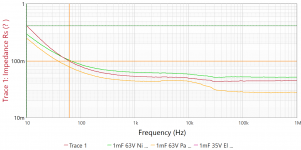
These graphs look very strange: from the first one, you could infer that the inductance of the tested caps increases to infinity when the frequency tends to zero, which is counter-intuitive, to say the least.For curiousity's sake, here are 3 1,000uF caps on the VNA impedance bridge. I toggled the display to "Q" and got an interesting graph. Will be happy to send them along if you PM me your address. Jack
My impression is that the extracted value is in fact the absolute value of the reactance, which fits perfectly well for a capacitor below its SRF.
The second graph is even more puzzling: if what is displayed is actually the Q factor of Ls, a dimension-less factor, it looks physically impossible: achieving such Q's from specially designed inductors is already extremely difficult and requires a huge size, but doing it casually, with just parasitic parameters seems even more impossible.
In addition, there seems to be resonant frequencies, something a passive L-R circuit should not display.
It would be interesting to know what equations the VNA uses to translate the s-parameters into physical quantities, it would probably solve the mystery.
Jack,
Can you identify the model of Nichicon cap you used?
The Panasonic FC 1,000uF 63V has a rated ESR of 43mohm at 100kHz and 20C for 31.5mmL part (36mohm for 35.5mL part).
Elna don't seem to want to specify ESR.
Your series resistance plot for FC model aligns with the datasheet rating assuming you weren't too far from 20degC.
- Status
- Not open for further replies.
- Home
- Amplifiers
- Power Supplies
- Measuring the "ESL" inductance of electrolytic caps (at 10 MHz!)