Hi guy's.
I make a Near field measurement for the woofer and the tweeter with my first order crossover.
I use with a Calculator for merge a curves.
But I have some problem with the measurement...
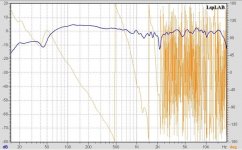
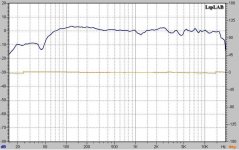
If I use with "Average Curves" calculator and select Complex operation, I have some problem in 2140Hz. maybe is where the crossover is cut between the woofer and the tweeter... But if I remove the "V" from the "Complex operation" box, The graph look much better!
Anybody can tell me what is a truth graph?
Thanks for help.
Graph 1: with "Complex operation"
Attachments
I'm not familiar with lspLAB, but my guess is that complex means, including phase - the orange curve in "graph1" indicates this. If I'm correct, then don't uncheck "complex operation", the phase information is important. E.g. read the Speaker Workshop manual 2.0 http://www.claudionegro.com/download.html - i know, it's a different software, but there is a lot of general speaker measurement theory.
I am not familiar with the software either, but indeed it seems like the "complex" option uses the phase of the signals when making the combined curve, just as in real life.
Both the name on the tick box and what happens indicates that this is the case.
If this is right, I cannot imagine a reason for not having it checked. In fact, I think the checkbox should not be there. The only function it has is to show that the program can do proper (complex) addition of the curves, and to demonstrate how bad (=nonrealistic) it is not to have it.
But maybe I fail to see a good reason right now. Anyone?
Hi
Just to get this right.
All this about check, don't uncheck etc. is a little confusing - phase information is mandatory in speaker design, therefore Graph 1 must be correct.
4lexander - IMO 100 dB gives a good overview, you can always zoom in.
Just to get this right.
All this about check, don't uncheck etc. is a little confusing - phase information is mandatory in speaker design, therefore Graph 1 must be correct.
4lexander - IMO 100 dB gives a good overview, you can always zoom in.
4lexander said:Hello,
But, any speaker will be like linear with 100dB range...
just my remark ...
4lexander
Agree 🙂 - but the resolution of graphs posted by Audist is almost 1dB. Personally I always zoom in on xo points etc, but also use the 100 dB view.
- Status
- Not open for further replies.
- Home
- Loudspeakers
- Multi-Way
- measurement on LspLAB

