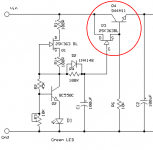
I've gotten interested in using the JFET-NPN hybrid Darlington connection shown in Figure 1 below. While a standard Darlington has an emitter follower which drives another emitter follower, this circuit has a JFET source follower which drives an emitter follower.
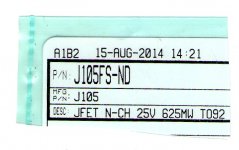
I think I'd like to try the "J105" device in this circuit, and as luck would have it, I bought 100 of them back in August of 2014. I keep a little snip of the shipping bag in my parts drawer, to remind me where and when I bought these units. The J105s came from DigiKey: Figure 2.
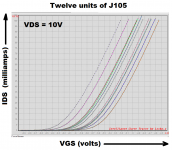
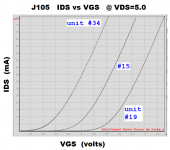
So I chose twelve J105 units at random, and put them on the curve tracer. I plotted IDS (vertical axis) against VGS (horizontal axis) with VDS held constant at 10 volts. The slope of this curve is d(Ids)/d(Vgs) which has a special name in circuit design: transconductance. Often written "gm".
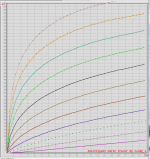
The measured data is shown in Figure 3. There's quite a spread in the data!
Simplistic mathematical models of JFET behavior suggest that IDS = Param1 * (VGS - Param2)**2 where Param1 is a gain factor related to the JFET's channel width and length, and Param2 is the "Pinchoff Voltage". "**2" means raised to the power 2, i.e, squared. The data in Figure 3 suggests that the spread of Pinchoff Voltage for these twelve J105s, is about 700 millivolts.
To see this, draw a horizontal line at IDS= 50 milliamps. It intersects the leftmost J105 curve at VGS= -5.7 volts, and it intersects the rightmost J105 curve at VGS= -5.0 volts. A spread of 0.7 volts (!).
If a (very small) sample of just 12 parts, gives a spread of 700 millivolts, I imagine that a larger sample will give a much bigger spread. I hope to measure many more J105s in the coming days, and find the very leftmost curve, and the very rightmost curve. These represent the extremes of the sample and, I hope, they may approximate the extremes of the population of all J105s ever built and sold.
If by some miracle I can find SPICE model parameters which fit these two extreme transistors, then I can simulate circuits using the "best" J105 ever built and also the "worst" J105 ever built. If my circuit design works acceptably with both extremes of J105 then I can feel confident it will probably work acceptably with average J105s that are not so extreme. That's the hope.
Fairchild's datasheet is also attached.
_
I think I'd like to try the "J105" device in this circuit, and as luck would have it, I bought 100 of them back in August of 2014. I keep a little snip of the shipping bag in my parts drawer, to remind me where and when I bought these units. The J105s came from DigiKey: Figure 2.
So I chose twelve J105 units at random, and put them on the curve tracer. I plotted IDS (vertical axis) against VGS (horizontal axis) with VDS held constant at 10 volts. The slope of this curve is d(Ids)/d(Vgs) which has a special name in circuit design: transconductance. Often written "gm".
The measured data is shown in Figure 3. There's quite a spread in the data!
Simplistic mathematical models of JFET behavior suggest that IDS = Param1 * (VGS - Param2)**2 where Param1 is a gain factor related to the JFET's channel width and length, and Param2 is the "Pinchoff Voltage". "**2" means raised to the power 2, i.e, squared. The data in Figure 3 suggests that the spread of Pinchoff Voltage for these twelve J105s, is about 700 millivolts.
To see this, draw a horizontal line at IDS= 50 milliamps. It intersects the leftmost J105 curve at VGS= -5.7 volts, and it intersects the rightmost J105 curve at VGS= -5.0 volts. A spread of 0.7 volts (!).
If a (very small) sample of just 12 parts, gives a spread of 700 millivolts, I imagine that a larger sample will give a much bigger spread. I hope to measure many more J105s in the coming days, and find the very leftmost curve, and the very rightmost curve. These represent the extremes of the sample and, I hope, they may approximate the extremes of the population of all J105s ever built and sold.
If by some miracle I can find SPICE model parameters which fit these two extreme transistors, then I can simulate circuits using the "best" J105 ever built and also the "worst" J105 ever built. If my circuit design works acceptably with both extremes of J105 then I can feel confident it will probably work acceptably with average J105s that are not so extreme. That's the hope.
Fairchild's datasheet is also attached.
_
Attachments
Its not unexpected to get a large spread in jfets. I've not used this particular one before, but I have previously bought batches (of 100) of J111 and J112. Very wide variances like this are normal.
But I wouldn't stress. Although i can't see Vout of your reg, I am guessing that the current through the jfet will be much less than 50mA. A few mA at most. I wouldn't fret too much. Rather than worrying about Vgs at 50mA, figure out the expected drain current, than measure Vgs for all devices at this current. The distribution will be much more 'normal' with a bigger sample.
But I wouldn't stress. Although i can't see Vout of your reg, I am guessing that the current through the jfet will be much less than 50mA. A few mA at most. I wouldn't fret too much. Rather than worrying about Vgs at 50mA, figure out the expected drain current, than measure Vgs for all devices at this current. The distribution will be much more 'normal' with a bigger sample.
If by some miracle I can find SPICE model parameters which fit these two extreme transistors, then I can simulate circuits using the "best" J105 ever built and also the "worst" J105 ever built.
_
A typical SPICE model has no means to specify spread of parameters. As the one below. If your simulator allows passing of parameters to models you would do better to calculate the BETA parameter (Idss/Vp**2) which SHOULD have far less spread (theoretically is has very little spread) and then pass VTO = -sqrt(Idss/BETA) to the model where you specify an Idss. In other words in the model below, VTO = -sqrt(Idss/0.0350699) where Idss is a global param. You could of course using the same formula simply pass a VTO but Idss is usually easier to measure (in your case you will need to do a fast pulse measurement since these FET's look like the will self-heat quickly).
.model LSK170B njf &
BETA = 0.0350699,VTO = -0.5375582 , LAMBDA = 4.951E-3 , &
IS = 2.76212E-14 , N = 1 , &
RD = 7.82168, RS = 6.69525888, &
CGD = 4.36E-11, CGS = 4.36E-11, &
PB = 1.2, MJd = 0.8892205, FC = 0.5, &
KF = 0 , AF = 1,MJs = 0.8892205
Last edited:
Thanks Scott! I will be making some Idss measurements today and tomorrow, using fast pulses and low duty cycles. The datasheet says that Idss is 500 milliamps MINIMUM. I figure that 10 volts of VDS and 1.2 amps of IDS gives 12 watts of dissipation during the measurement. For a TO92 plastic packaged small signal transistor! So I'll try to do it quickly and let it cool a long time between pulses. At a duty cycle of 0.02% the average power dissipation will be 2.4 milliwatts which seems reasonable.
It remains to be seen but I'm guessing my test rig might have as much as 10 microhenries of parasitic inductance and as much as 500 pF of parasitic capacitance. The resonant frequency of these is 2.2 MHz. Assuming it takes ten or fifteen cycles for the oscillatory ringing to die down, before the ADC input is flat and stable, that's 7 microseconds. Then give the ADC 30 microseconds to acquire and we need a (37 + safety margin) microsecond pulse width. Let's say 50us as a starting guess.
I think I'm just going to make two models, J105fast and J105slow, with hard-coded numbers in each one and no passing of parameters. Then I'll simulate my circuits using the J105fast transistor and make sure they work OK. Then I'll simulate them again using the J105slow transistor and make sure they also work OK. I figure if circuit simulations pass these two Torture Tests, my circuits will probably be OK with non-extreme J105s.
Anything you do along these lines will probably improve the chance that you will be OK with your design.
Measured IDSS = 1.1 amperes today
I cobbled together my J105 IDSS test jig today, and tried it out on a sacrificial device.
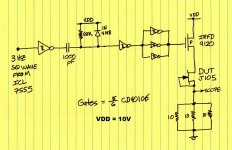
The schematic is Figure 1 below. The 1000 pF capacitor and 68K resistor create a negative going pulse whose width is about 68 microseconds. The repetition rate is 3 Hz (333 msec period) so the duty cycle is 68E-6/333E-3 = 0.02%. The JFET under test heats up for 68 microseconds and cools down for 333 milliseconds.
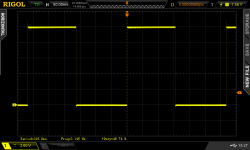
The actual clock waveform from the CMOS 555 timer/oscillator chip is shown in Figure 2. Its period turned out to be 318 msec instead of 333. No problem.
The gate waveform of the IRFD9120 power PMOS FET (low = ON, high = OFF) is shown in Figure 3. Its pulsewidth turned out to be 53 microseconds instead of 68. Also no problem.
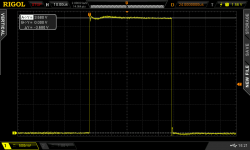
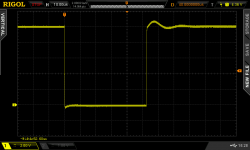
The voltage across the 3.33 ohm sensing resistor is shown in Figure 4. The measured voltage is 3.68 volts, which means the drain current of the J105 under test was (3.68 / 3.33) = 1.10 amperes (!!). Yes Virginia we just tested a plastic packaged, small signal transistor at five watts of instantaneous power dissipation, and it survived.
Figure 4 seems to show that I could reduce the test pulse width to ~ 30 or 40 usec and still have a nice flat current waveform to measure. That would reduce DUT power dissipation another 20% to 40% which would be nice.
Tomorrow I think I might add another PFET or two in parallel with the existing device, just to reduce its VDS a little bit more. And test some more devices.
_
I cobbled together my J105 IDSS test jig today, and tried it out on a sacrificial device.
The schematic is Figure 1 below. The 1000 pF capacitor and 68K resistor create a negative going pulse whose width is about 68 microseconds. The repetition rate is 3 Hz (333 msec period) so the duty cycle is 68E-6/333E-3 = 0.02%. The JFET under test heats up for 68 microseconds and cools down for 333 milliseconds.
The actual clock waveform from the CMOS 555 timer/oscillator chip is shown in Figure 2. Its period turned out to be 318 msec instead of 333. No problem.
The gate waveform of the IRFD9120 power PMOS FET (low = ON, high = OFF) is shown in Figure 3. Its pulsewidth turned out to be 53 microseconds instead of 68. Also no problem.
The voltage across the 3.33 ohm sensing resistor is shown in Figure 4. The measured voltage is 3.68 volts, which means the drain current of the J105 under test was (3.68 / 3.33) = 1.10 amperes (!!). Yes Virginia we just tested a plastic packaged, small signal transistor at five watts of instantaneous power dissipation, and it survived.
Figure 4 seems to show that I could reduce the test pulse width to ~ 30 or 40 usec and still have a nice flat current waveform to measure. That would reduce DUT power dissipation another 20% to 40% which would be nice.
Tomorrow I think I might add another PFET or two in parallel with the existing device, just to reduce its VDS a little bit more. And test some more devices.
_
Attachments
Can you add a source resistor and re-measure the Id when gate is shorted to the bottom of that source resistor?
Can you then use that info to work back to predict the Idss (when Vgs=0) from your test measurement?
Can you then use that info to work back to predict the Idss (when Vgs=0) from your test measurement?
Scott Wurcer suggests a slightly different procedure:
- Measure both the Vp and also the IDSS, of several J105 devices
- Make a scatter plot of Vp versus IDSS
- Verify that the scatter plot is not a bunch of uncorrelated randomness
- Calculate BETA = IDSS / (Vp * Vp) for each J105
- Calculate the average value of BETA for the data in step 4
- Now for each new J105 being tested, you only measure Vp (at 10uA). Its IDSS = BETA*Vp*Vp. No more measurements at 1.1 amps!!
Borbely also has a jFET tester that includes VP measurement facility.
Without Vp, testing is nearly useless.
Vp can be inferred from your plots (maybe 7Vgs to 8Vgs). It's where Vgs is when Id <<<<<1dss, the spec sheet should give the Id for this test. Probably 0.1uA to 1uA.
Without Vp, testing is nearly useless.
Vp can be inferred from your plots (maybe 7Vgs to 8Vgs). It's where Vgs is when Id <<<<<1dss, the spec sheet should give the Id for this test. Probably 0.1uA to 1uA.
In search of weak inversion / subthreshold behavior
Real-life MOSFETs exhibit a phenomenon called Subthreshold Conduction / Weak Inversion, when the channel is almost completely pinched off. In this regime, drain current vs gate voltage doesn't abruptly fall to zero; instead it gradually falls away exponentially. Current vs voltage on semilog plots is a straight line.
I figured that the big brutal J105 JFET might do the same thing, so I took some data and made a couple plots.
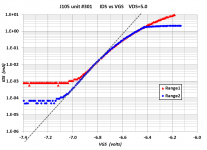
My curve tracer isn't auto-ranging; I have to set the range switches manually. So I let the two data-sets overlap across the range boundary. In Figure 1 the red data is for the high current range and the blue data is for the low current range. The larger value of current sensing resistance in the blue setup, means that it is limited to ~ 1.5 mA and below.
Plotting the data on semilog axes gives Figure 2. Clearly my curve tracer doesn't have unlimited dynamic range; the minimum current it can read is a function of the range setting: about 0.8 microamps on the red setting, and about 70 nanoamps on the blue setting.
I did my best to fit a straight line to the semilog plot. The dotted line on the plot seems to fit nicely for only 2 decades of current, from about 0.3uA to about 30uA. So, tentatively, I conclude that subthreshold conduction doesn't need to be modeled for the J105. It certainly does not occur at the current levels where I plan to operate the device (1mA - 500mA).
Oh by the way, those who are interested in "the pinchoff voltage Vp" are invited to find it on these plots of real data measured on a real transistor. Once you've found Vp, explain why that particular dot on these measured curves, is somehow more significant or more suggestive than the neighboring dots.
_
Real-life MOSFETs exhibit a phenomenon called Subthreshold Conduction / Weak Inversion, when the channel is almost completely pinched off. In this regime, drain current vs gate voltage doesn't abruptly fall to zero; instead it gradually falls away exponentially. Current vs voltage on semilog plots is a straight line.
I figured that the big brutal J105 JFET might do the same thing, so I took some data and made a couple plots.
My curve tracer isn't auto-ranging; I have to set the range switches manually. So I let the two data-sets overlap across the range boundary. In Figure 1 the red data is for the high current range and the blue data is for the low current range. The larger value of current sensing resistance in the blue setup, means that it is limited to ~ 1.5 mA and below.
Plotting the data on semilog axes gives Figure 2. Clearly my curve tracer doesn't have unlimited dynamic range; the minimum current it can read is a function of the range setting: about 0.8 microamps on the red setting, and about 70 nanoamps on the blue setting.
I did my best to fit a straight line to the semilog plot. The dotted line on the plot seems to fit nicely for only 2 decades of current, from about 0.3uA to about 30uA. So, tentatively, I conclude that subthreshold conduction doesn't need to be modeled for the J105. It certainly does not occur at the current levels where I plan to operate the device (1mA - 500mA).
Oh by the way, those who are interested in "the pinchoff voltage Vp" are invited to find it on these plots of real data measured on a real transistor. Once you've found Vp, explain why that particular dot on these measured curves, is somehow more significant or more suggestive than the neighboring dots.
_
Attachments

Found my J105fast and J105slow transistors
I put fifty J105s on the curve tracer and hunted for the transistor with highest IDSS (I'll call that one "J105fast"), and also for the transistor with lowest IDSS (I'll call it "J105slow"). And here they are, serial numbers 34 and 19 respectively. Delta-VGS at constant IDS seems to be about 900 millivolts.
Now I'll try to fit the LTSPICE modeling equation + parameters, to measured data from units 34 and 19. If successful, I think the J105fast model and the J105slow model will be very useful for worst-case-scenario circuit design and simulation.
_
Attachments
Probably 0.1uA to 1uA.
Which will give different answers with possibly neither useful and yes sub-threshold behavior complicates things even more. As Mark has found as have I the J series of switches grossly deviate from square law behavior unlike the Toshiba JFET's and require a different approach.
One man's fast is another man's leaky.
Any chance at a distribution plot for the population or is that data pending? (Thanks for the data, no less!) That's a pretty broad spread.
And pinch off seems close to -7.1 V, if I remember my jfets right (no guarantee). It's right where the ever so slight subthreshold trace flattens out, but that could be the noise floor, too.
Keep in mind that the J105 is only good for 25V, which will cramp its style somewhat. I have a bag of those floating around that i bought from Mouser a while back. I also have a pile of its little brother, the J107, gotten for cheap from Electronic Goldmine. I haven't thought of very many uses for the things yet. I think I got the J105s based on the novelty of their relatively low Rdson for a jfet. To get the low Rds and high IDSS, the gate area (and hence the gate capacitance) is relatively large. I had some small hope for the J107s as low noise devices based on this information - I've yet to test that.
I had some small hope for the J107s as low noise devices based on this information - I've yet to test that.
The low frequency noise is often a crap shoot on these switching devices but the J305 has a good yield. I never got any J105's to test even though they seem cheap and plentiful.
Consult Horowitz and Hill 3rd edition page 516 for their noise measurements on J107. They give it a mild endorsement: "Also consider the Fairchild J107, a low-cost switch that can moonlight as a low-noise JFET; with luck it will remain available."
Ugly! I'm not quite so certain I want to use this transistor in a JFET+NPN hybrid Darlington circuit as shown in post #1.
_
Well they are meant to be on or off in the intended application.
- Home
- Amplifiers
- Solid State
- Measured data on the J105 Nchannel JFET