I am planning to build a multichannel master volume control with LDR and B1 buffer, see this thread.
Ordered 20 LDR's, I need 6 pairs.
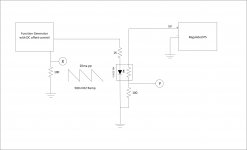
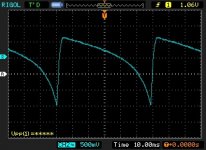
Setup a circuit to look at the response curves on the XY oscilloscope.
The LED current to swings from 0 to 20ma. I had to use a very slow ramp frequency as I noticed that the faster ramp had a very clear lag on the output side of the LDR, at low LED current it needs some time to stabilize the output resistance.
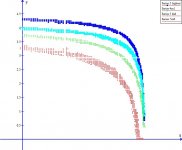
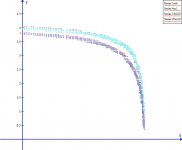
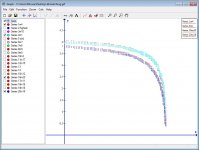
I captured the raw channel data for all 20 LDR and then imported them into the GRAPH program. I have shown two samples from the graph program, one that shows 4 LDR's with their outputs clearly different, one is the lowest (much lower than the others) and one is the highest (much higher than the others). The next one is 4 LDR's, 2 matched pairs. It was quite easy to match by just turning on or off the different LDR data. From 20 LDR's I was able to get 6 matched pairs.
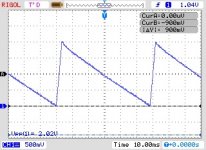
Also, it appears that as the LED current approaches the 20ma it starts to become nonlinear, can be seen on the ramped below.
Does this matching approach appear sound?
Ordered 20 LDR's, I need 6 pairs.
Setup a circuit to look at the response curves on the XY oscilloscope.
The LED current to swings from 0 to 20ma. I had to use a very slow ramp frequency as I noticed that the faster ramp had a very clear lag on the output side of the LDR, at low LED current it needs some time to stabilize the output resistance.
I captured the raw channel data for all 20 LDR and then imported them into the GRAPH program. I have shown two samples from the graph program, one that shows 4 LDR's with their outputs clearly different, one is the lowest (much lower than the others) and one is the highest (much higher than the others). The next one is 4 LDR's, 2 matched pairs. It was quite easy to match by just turning on or off the different LDR data. From 20 LDR's I was able to get 6 matched pairs.
Also, it appears that as the LED current approaches the 20ma it starts to become nonlinear, can be seen on the ramped below.
Does this matching approach appear sound?
Attachments
Last edited:
slow means they take time to reach quiescent state.
That is very important to the testing methodology.
We listen to the outputs from the LED/LDR while they are in the quiescent state. We rarely listen while twiddling the knob. Rare = <0.01% of total time, i.e. <8.64seconds of twiddling a day.
The selection of the LED/LDRs must be weighted very strongly towards quiescent parameters. Slow variations of control voltages seem to me to be a complete waste of resources.
You are correct that we don't listen while twiddling the knob but we select our desired volume level by turning the knob slowly and stopping were we like it. The sweep I used takes 2 seconds to complete. I ran the sweep slower as well but did not perceive any difference. Fast sweeps did not give the LDR enough time to respond.
I will try some of the matched pairs manually to verify if indeed the are matched by using just A few DC control levels.
I do like the graphical matching approach as it can be done quickly without writing anything down with pen or pencil. It is all done paperless and the matching is visual.
I will try some of the matched pairs manually to verify if indeed the are matched by using just A few DC control levels.
I do like the graphical matching approach as it can be done quickly without writing anything down with pen or pencil. It is all done paperless and the matching is visual.
Last edited:
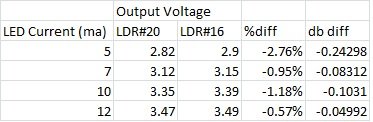
Ran a few current points on LDR#20 and LDR#16 (one of the matched pairs found by the graphical method). There appears to be a good correlation between the fixed LED current matching and the slow sweep graphical method.
The currents/voltage obtained manually fit between the graphical curves. Doing it manually definitely took a lot more time per LDR.
The currents/voltage obtained manually fit between the graphical curves. Doing it manually definitely took a lot more time per LDR.
Attachments
- Status
- Not open for further replies.