I need some help with taking distortion sims with LT Spice. The normalization seems weird to me. Why is isn't the fundamental of 1KHz at zero dB? And is there a way to see just magnitude and not dB scale?
Attachments
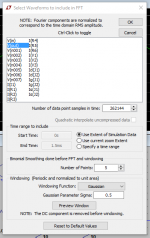
LtSpice references FFT's to the input source voltage. If the input is say 1V at 1kHz, and the output is 1V at 1kHz, then it will show the peak at 1kHz at 0dB, ie a gain of 1, with all other peaks (hopefully) lower than 0dB. It looks to me like there's either no input at 1kHz, or it's being substantially filtered out by your circuit.
And yes, you can look at magnitudes in the FFT plot. Right click on the FFT plot and select "Manual Limits", then under "Left Vertical Axis" drop down the selection box ("Decibels") and select "Linear".
And yes, you can look at magnitudes in the FFT plot. Right click on the FFT plot and select "Manual Limits", then under "Left Vertical Axis" drop down the selection box ("Decibels") and select "Linear".
Thanks! I'll try that with the magnitude.
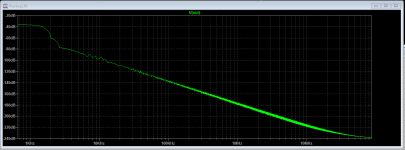
the graph I posted was messed up. I found some help in the Yahoo LT Spice group. I'll share what they told me ... it really helped.
---------------------------------------------------------------------------
"I need some help with doing distortion sims with LT Spice."
Please don't refer to files in off-site storage. This group you joined has a storage area specifically for users to upload their schematics. Please use it. Also please read the information about the group that you saw when you joined it. Upload files to here:
https://groups.yahoo.com/neo/groups/LTspice/files/ Temp/
Pictures can be uploaded here:
https://groups.yahoo.com/neo/groups/LTspice/photos/albums
but pictures and screenshots are CONSIDERABLY less useful than LTspice schematics are. (*.asc files)
"Why isn't the fundamental of 1KHz for the plot shown at zero dB?"
Because your signal does not have a component at 1 kHz with an amplitude of 1V RMS. (Or was that 1V peak? I forget.) LTspice's FFT plot shows you the actual amplitudes, converted to decibels (actually to dBv), not something relative to some random frequency. Yes, 1 kHz is a random frequency.
You can adjust the relative vertical position, by scaling (multiplying) the thing that is plotted. On the FFT plot, if you right-click on "V(out)" at the top of the plot and change it to 100*V(out), it will raise it by +40 dB.
"And is there a way to see just magnitude and not dB scale fot the distortion plot."
Yes. Right-click on the Y-axis numbers. Change the plot from Decibel to either Logarithmic or Linear.
It looks like whatever voltage waveform you have, was not periodic. And then you applied a window function. Distortion is meaningless.
Regards,
Andy
-----------------------------------------------------------------------------------
Hello,
Please follow the procedure below to get good results with the FFT. The same applies to the .FOUR analysis.
1. The time frame has to be exactly a multiple of the period time, e.g. exactly 5 periods.
2. The signal has to be at steady state. This means you don't have any transient settling to the DC-value of the signal.
3. Use a maximum time step of less than 1/100 of period time in .TRAN.
4. Turn off data compression with the SPICE directive below.
.options plotwinsize=0
5. The FFT plots RMS values. You can scale teh FFT-plot if you change V(out) to V(out)*any_number, e.g. V(out)*100
6. You can use :FOUR instead of the FFT to get the Fourier coefficients. See the example below.
THD.asc
https://groups.yahoo.com/neo/groups/LTspice/files/ Tut/
Best regards,
Helmut
-------------------------------------------------------------------------------------
Another couple of things to add to Helmut's list of essentials:
7. Have around 5-30 cycles of the fundamental signal frequency. If it's a 1 kHz signal, take 10 ms of the waveform and pass that to the FFT.
8. Don't use any Windowing in the FFT -- unless it is impossible to start with a periodic waveform.
Andy
Attachments

- Status
- Not open for further replies.