Waly, AFAIK only simulators show Y axis in V/rt(Hz). Instruments use dB, dBu, dBV and you need to take BW and bin width into account, when calculating noise from noise spectral density.
This thread has turned into HydrogenAudio.
Is that good or bad?
Hard to answer in the grand scheme of things. I still ask myself, where is that perfect sound forever? promised in the 80'sIs that good or bad?
Hard to answer in the grand scheme of things. I still ask myself, where is that perfect sound forever? promised in the 80's
Some of my favorite recordings are clearly flawed in some way so perfect must be relative.
Some of my favorite recordings are clearly flawed in some way so perfect must be relative.
Quote of the day!
Waly, AFAIK only simulators show Y axis in V/rt(Hz). Instruments use dB, dBu, dBV and you need to take BW and bin width into account, when calculating noise from noise spectral density.
Incorrect. I still have to find a non-toyish spectrum analyzer that doesn't have the option to display V/rtHz or dBV/rtHz on the Y scale. Even free PC tools like Arta have this option, and it's also available for log sweeps (not very common in standalone spectrum analyzers). Of course, you have to know about and look it up, it is not the default setting.
Thanks PMA for your comments on measuring...
You provide measurements to back up your comments and that is appreciated for we know how much work that is...
Are you in agreement with the measurements found here?
Cambridge Audio DacMagic Plus Review
thanks in advance,
dennis h
You provide measurements to back up your comments and that is appreciated for we know how much work that is...
Are you in agreement with the measurements found here?
Cambridge Audio DacMagic Plus Review
thanks in advance,
dennis h
Dennis,
That DacMagic Plus looks like it may actually be the real deal, with performance similar to a Benchmark DAC-1, and it looks like it has a better headphone amp. There are various opinions in reviews, some people like it as well or more than DAC-1 and some less so. For $349, it is extremely tempting. So, I just ordered one to find out how I like it. Should be here in less than a week. We'll see. I can always send it back, depending.
That DacMagic Plus looks like it may actually be the real deal, with performance similar to a Benchmark DAC-1, and it looks like it has a better headphone amp. There are various opinions in reviews, some people like it as well or more than DAC-1 and some less so. For $349, it is extremely tempting. So, I just ordered one to find out how I like it. Should be here in less than a week. We'll see. I can always send it back, depending.
Last edited:
Thats a big claim, Benchmark doesnt just win on measurements though, people subjectively like thrm too. Theyve done a little home work than you might expect.
I upgraded from DAC 1 to DAC 2. The BenchMark 2 is a slight audible improvement over their DAC 1.
THx-RNMarsh
THx-RNMarsh
Are you in agreement with the measurements found here?
Cambridge Audio DacMagic Plus Review
thanks in advance,
dennis h
Well, mostly yes, though I think I got better result for Toslink jitter.
Attachments
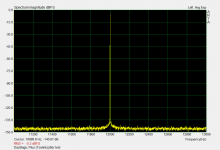
Incorrect. I still have to find a non-toyish spectrum analyzer that doesn't have the option to display V/rtHz or dBV/rtHz on the Y scale.
So maybe I was just using wrong settings?
Attachments
So maybe I was just using wrong settings?
No, you are just not measuring "noise", but a signal spectrum. A small but essential difference.
I upgraded from DAC 1 to DAC 2. The BenchMark 2 is a slight audible improvement over their DAC 1.
THx-RNMarsh
Richard, any news about amps?
BR Damir
No, you are just not measuring "noise", but a signal spectrum. A small but essential difference.
Yes, but I understand this.
Still you can get the noise level, related to reference level and measurement bandwidth, from spectrum, when measuring output with no input signal. In Arta and similar SW, you get the "RMS" value, which is the RMS voltage noise at the actual setting, say for 48kS/s it is for 24kHz BW unweighted, unless the weighting was chosen. It can be also calculated from "noise floor", e.g. for -140dB "bottom floor" with 0dBFS = 1V, 48kS/s and 65536 samples in the FFT record (0.73Hz bin width), after some trivial calculations we get noise voltage of 19.84uV over 20kHz BW unweighted. This is S/N = 94dB/1V/20kHz or, in other words, 140nV/rtHz. Hope I did not make many mistakes in trivial maths.
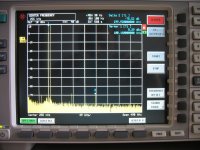
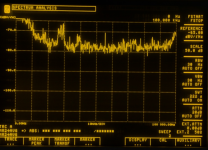
Waly, AFAIK only simulators show Y axis in V/rt(Hz). Instruments use dB, dBu, dBV and you need to take BW and bin width into account, when calculating noise from noise spectral density.
This is not a simulation. W&G SNA-33 spectrum analyzer, 1Hz resolution BW from
20Hz to 26 GHz. It has some DSP, but is essentially a purely analog device.
BTW this is the noise of a R&S NGT20 lab power supply, 5V from the rightmost channel.
-100 dB/rtHz is 1nV/rtHz
Attachments
- Status
- Not open for further replies.
- Home
- Member Areas
- The Lounge
- John Curl's Blowtorch preamplifier part II