I'm bad a stats, but trimodal distributions do occur quite often. Does look like a sinc pulse if you squint tho, so may be an anomaly from the analysis. You certainly wouldn't expect a skinny sigma graph for mpg given different driving styles and conditions across a continent.
Hi,
I can work out :
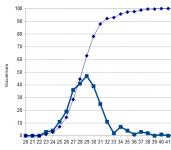
10% of the time your doing > 33mpg.
40% of the time your doing 29 to 33 mpg.
40% of the time your doing 24 to 28 mpg.
10% of the time your doing < 24 mpg.
rgds, sreten.
I can work out :
10% of the time your doing > 33mpg.
40% of the time your doing 29 to 33 mpg.
40% of the time your doing 24 to 28 mpg.
10% of the time your doing < 24 mpg.
rgds, sreten.
Last edited:
Is the deviation from Gaussian just noise?
And quantization, too. Looks Gaussian to me, the tails don't tell much.
I had a few hypotheses that I tested with graphs etc. Haven't quite narrowed it down. Thought earlier of quantization and dropping the bins down to every tenth of a mpg to see if the pattern remains. I have only 317 data points. Car is an '02 Saturn twin cam. Gets amazing mpg (~40) at 55mph.
Googling "relationship between fft and histogram" reveals better results than my previous searches, but most of the results are in image processing (I was earlier including the term "samples", which is obviously a confounding term) 😉
Googling "relationship between fft and histogram" reveals better results than my previous searches, but most of the results are in image processing (I was earlier including the term "samples", which is obviously a confounding term) 😉
Last edited:
I tried making similar plots with my Honda Element over a 4 year period when I lived in Florida. I did the same with my Mustang before that. They ran pretty much the same trip every week, work, school, not much else, since we took Sherri's car for most other trips. There were a few outlying bins, The outliers were mostly on the low side and I attributed them to the occasional trips when my 3 mile work commute took 45 minutes, road construction, accidents, and winter tourist traffic.
A friend bought a then new Toyota Camry Hybrid which has much better data gathering on MPG, and gets much better mileage, so small changes are easier to spot. He had a 15 mile commute, and drove his minivan for most of his other driving. He also kept better notes, which pointed out the real reason for the outliers....different brands and grades of gas.
I had always checked the prices of the gas stations on my route and stopped wherever the price was cheaper. He took detailed notes, and figured out his lowest cost per mile (some hybrid owners tend to do that) which turned out to be quite dependent on the brand of fuel. I believe Chevron was his favorite, but every geographic area gets a different blend, which also changes with the season. Even if you go to the same gas station every day, their blend will change with the seasons, particularly in areas with temperature extremes, or areas prone to extreme changes.
In south Florida, bulk fuel comes into Port Everglades, or the Port of Miami. All major delivery tankers start out with the same bulk fuel regardless of which brand of fuel they are delivering. Each brand gets its own unique additive package, which may or may not be fully or properly blended in. This leaves ample opportunity for variation.
Is this fuel economy data based on measured distance between fills and fuel added or is it derived from the vehicle fuel economy display? If it's the former there is an unusually wide skew between the mean/median and those two population bumps at 34 and 40 MPG unless those are very unusual trips between fills.
The lower side distribution is pretty understandable given your location as winter driving in MN especially if it involves relatively short trips would be a major hit to MPG.
The lower side distribution is pretty understandable given your location as winter driving in MN especially if it involves relatively short trips would be a major hit to MPG.
It is data based on fill-ups over the past ~9 years.
Before posting, I had that thought about winter driving and checked the occurrences of 23MPG and they do not reliably fall during winter (or any) months. I thought it might be peaks showing when the car was filled on a level, vs inclined either way, but I don't think that is the case.
Thinking about this again, my trips were more sporadic and mileage more variable when I first owned the car (walked to work) vs. today.
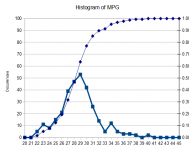
So I looked at histograms before and after moving. Before moving the histogram had three peaks of almost equal height at 23, 28-29 and 34.
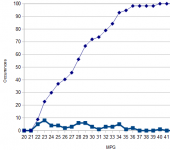
After moving there was a more normal shape with peak around 29, but still "sinc" bumps above at 34, 37 and 40 for the occasional all-highway trips I do. only a very slight excess at 23 remains.
Before posting, I had that thought about winter driving and checked the occurrences of 23MPG and they do not reliably fall during winter (or any) months. I thought it might be peaks showing when the car was filled on a level, vs inclined either way, but I don't think that is the case.
Thinking about this again, my trips were more sporadic and mileage more variable when I first owned the car (walked to work) vs. today.
So I looked at histograms before and after moving. Before moving the histogram had three peaks of almost equal height at 23, 28-29 and 34.
After moving there was a more normal shape with peak around 29, but still "sinc" bumps above at 34, 37 and 40 for the occasional all-highway trips I do. only a very slight excess at 23 remains.
You have to normalize the MPG for the quantity of fuel in the tank, normalize it for temperature.
When an airplane takes off with full tanks it spends a lot of energy transporting the fuel, same with cars, same with hauling around your wife and her sister...
When an airplane takes off with full tanks it spends a lot of energy transporting the fuel, same with cars, same with hauling around your wife and her sister...
You have to normalize the MPG for the quantity of fuel in the tank, normalize it for temperature.
When an airplane takes off with full tanks it spends a lot of energy transporting the fuel, same with cars, same with hauling around your wife and her sister...
12 gallons of fuel weigh roughly 72 pounds, IMO not exactly significant in perhaps 2600lb of car and cargo.
The temperature of the gas during the fill can have an effect. You're in minnesota....
Also, perhaps you're filling up at three gas stations, and on average you're not being gypped..
John
Also, perhaps you're filling up at three gas stations, and on average you're not being gypped..
John
Last edited:
Even if you go to the same gas station every day, their blend will change with the seasons, particularly in areas with temperature extremes, or areas prone to extreme changes.
I've never bothered doing mpg trending with my car as I erm, generally drive like I rented it. Long motorway trips where the average speed is controlled by traffic I do get 50-70 more miles out a tank. but the range is generally 38-45mpg (uk gallons). But there is significant drop in winter when they put the winter blend diesel in the pumps.
When I finally kill it doubt I will get another diesel tho. This was last of the semi-clockwork models. Luckily so far have been unable to kill it. Cars don't live as long in Europe as they can in USA, so at 274k its high mileage for here, 'meh' for some people over the pond 🙂
Back OT I could see me having a high side outlier, such as a 900 mile road trip last year. But can't think why a matching low side other than when my fuel filter sprung a leak...
As far as seasonal variations due to density or fuel blend, I do see a roughly sine wave +/- 1.5 average mpg. Max in summer, minimum in winter.
Fuel Density vs temp (maybe a 2-3% difference over likely storage temp range) Minimum in summer, maximum in winter
https://www.ic.gc.ca/eic/site/mc-mc.nsf/eng/lm00129.html
blend effects also ~2% difference between summer (max) and winter (min)
https://en.wikipedia.org/wiki/Gasoline_gallon_equivalent
These last two effects (fuel density and blend) may cancel out to some degree as they are opposite in sign..
I think the winter minimum is as likely to be air density related and richer mixtures in a longer warmup.
Just to underline what I wrote in post 9. Most of the variation was from before the move when I didn't have a commute. Here are shots of before and after. Before the move I have 3 peaks, which I will call: goofing off, running errands and trips. After, it is mainly commuting and trips.
The low side outlier before the move I am guessing is mainly goofing off: spirited driving, holding a lower gear etc... Not anything silly like racing (stoplight or otherwise) a 100 WHP commuter car 😉
There is a gradual downward trend lately. New plugs and wires fixed some misfire codes, but had no effect on mpg, thinking it could be O2 sensor or blowby. Seems to be burning less oil lately, though; perhaps odd for a Saturn 😉
Attachments
Last edited:
- Status
- Not open for further replies.
- Home
- Member Areas
- The Lounge
- interesting data histogram - statistics experts?