I am having a hard time figuring out what I should be taking away from these spectrum decay plots and the waterfalls. Am I looking to see which ones die off the soonest? What would a perfect driver look like?
All these plots are taken from a zaph 5"
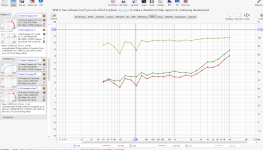
While we're at it... what should I be reading from this Clarity tab?
All these plots are taken from a zaph 5"
While we're at it... what should I be reading from this Clarity tab?
Attachments
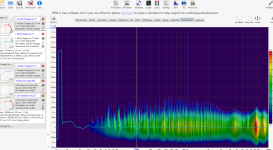
Stretch that scale up a bit. You can prob hear 25-30db below the signal. There is also the noise floor. This is the quiet sound of your room. Seeing this in a measurement does not really help you. Also the ear hears closer to 1/6th or psychoacoustic rounding so turn that on. You also want to gate the measurement so you don't include things bouncing all over the room. Depending how far you are from the speaker 4ms-5ms is good.

What to look for? It is good to take measurements at a few different angles. If you are looking where to put an XO you should look at the length of the decay and any ringing.
From what I understand the ear/mind can hear what happens at 30ms and 300ms.
Just my 2cents.
What to look for? It is good to take measurements at a few different angles. If you are looking where to put an XO you should look at the length of the decay and any ringing.
From what I understand the ear/mind can hear what happens at 30ms and 300ms.
Just my 2cents.
So the Y plane is time then right?
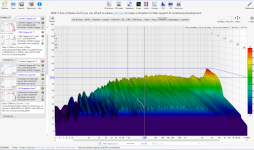
This is the total system of my most recent 3 way. The zaph and the tweeter both ring a bit. So is that what I am seeing here? It comes out really far so its ringing really bad?
Note: I took this when I had the mid inverted on accident so thats why there is a big indent at 2500 hz
This is the total system of my most recent 3 way. The zaph and the tweeter both ring a bit. So is that what I am seeing here? It comes out really far so its ringing really bad?
Note: I took this when I had the mid inverted on accident so thats why there is a big indent at 2500 hz
Attachments
Y are spls. Z moving torward you is time. Mess with the perspective settings and you can see the scales.So the Y plane is time then right?
Use the plus in the upper left to stretch out Y. Use the slider on the left side of the plus/minus to move the whole graph up or down.
The right corner +/- can stretch the frequency. It can help to see ringing by moving the decay into the graph's edge.
Last edited:
I have an SPL meter. Some of these measurements were not taken with the SPL so that might be why they look so terrible.
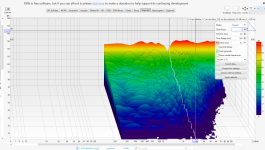
Basically I want to see that waterfall drop right off correct? The zaph and the hivi planar seem to both ring a bit where the Peerless woofer looks super clean. I find that odd since the peerless is a pretty large 8" driver.
Basically I want to see that waterfall drop right off correct? The zaph and the hivi planar seem to both ring a bit where the Peerless woofer looks super clean. I find that odd since the peerless is a pretty large 8" driver.
Just be sure you are looking around 30db below the signal and ignoring things past that or what is in your noise floor. Open the RTA in rew or look at your distortion measurement if you want to see where the floor is- it changes levels across the frequencies.The zaph and the hivi planar seem to both ring a bit
Yes. If you are looking at lower frequencies you will have to increase the window. Ideally you want it to drop off evenly with no consistent peaks. The baffle and room come into play.Basically I want to see that waterfall drop right off correct?

- Home
- Loudspeakers
- Multi-Way
- How to read Spectrum Decay and Waterfall plots in REW