You can't measure a damn thing with LTSpice as it is a simulator rather than measuring equipment.
If you want to simulate more accurately, turning off data compression, giving the circuit more time to settle, restricting the maximum timestep and reducing reltol are things you could try.
If you want to simulate more accurately, turning off data compression, giving the circuit more time to settle, restricting the maximum timestep and reducing reltol are things you could try.
I did most of your recommendations, I made it measure between 1s and 1.1s, The FFT is set to analyze 80ms to 100ms of the measured data. I am by far to reach 0%. This character is paramount importance on this website, as members give full credibility to values presented by this gadget.
I invite all those who wants to establish a normalized way to measure distortion to get a credible comparison , to participate in development of such methodology.
Hayk
I invite all those who wants to establish a normalized way to measure distortion to get a credible comparison , to participate in development of such methodology.
Hayk
Attachments
there is a guide to LTspice in software
Installing and using LTspice IV (now including LTXVII). From beginner to advanced.
certainly more than a 'gadget'
Installing and using LTspice IV (now including LTXVII). From beginner to advanced.
certainly more than a 'gadget'
see attached
.OP point found by inspection.
N-Period=1
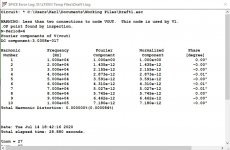
Fourier components of V(vout+)
DC component:3.13601e-007
Harmonic Frequency Fourier Normalized Phase Normalized
Number [Hz] Component Component [degree] Phase [deg]
1 1.000e+03 2.222e-01 1.000e+00 -80.96° 0.00°
2 2.000e+03 4.975e-08 2.239e-07 4.55° 85.51°
3 3.000e+03 3.323e-08 1.495e-07 3.04° 83.99°
4 4.000e+03 2.494e-08 1.122e-07 2.28° 83.24°
5 5.000e+03 1.995e-08 8.978e-08 1.82° 82.78°
6 6.000e+03 1.663e-08 7.483e-08 1.52° 82.48°
7 7.000e+03 1.426e-08 6.415e-08 1.30° 82.26°
8 8.000e+03 1.248e-08 5.613e-08 1.14° 82.10°
9 9.000e+03 1.109e-08 4.990e-08 1.01° 81.97°
10 1.000e+04 9.981e-09 4.491e-08 0.91° 81.87°
11 1.100e+04 9.074e-09 4.083e-08 0.83° 81.79°
12 1.200e+04 8.318e-09 3.743e-08 0.76° 81.72°
13 1.300e+04 7.678e-09 3.455e-08 0.70° 81.66°
14 1.400e+04 7.130e-09 3.208e-08 0.65° 81.61°
15 1.500e+04 6.654e-09 2.994e-08 0.61° 81.56°
16 1.600e+04 6.239e-09 2.807e-08 0.57° 81.53°
17 1.700e+04 5.872e-09 2.642e-08 0.54° 81.49°
18 1.800e+04 5.545e-09 2.495e-08 0.51° 81.46°
19 1.900e+04 5.254e-09 2.364e-08 0.48° 81.44°
20 2.000e+04 4.991e-09 2.246e-08 0.46° 81.41°
21 2.100e+04 4.753e-09 2.139e-08 0.43° 81.39°
22 2.200e+04 4.537e-09 2.042e-08 0.41° 81.37°
23 2.300e+04 4.340e-09 1.953e-08 0.40° 81.35°
24 2.400e+04 4.159e-09 1.871e-08 0.38° 81.34°
Total Harmonic Distortion: 0.000035%(0.000000%)
Date: Mon Jul 13 20:21:25 2020
Total elapsed time: 16.156 seconds.
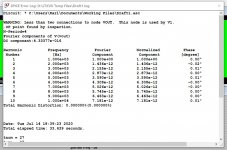
.OP point found by inspection.
N-Period=1
Fourier components of V(vout+)
DC component:3.13601e-007
Harmonic Frequency Fourier Normalized Phase Normalized
Number [Hz] Component Component [degree] Phase [deg]
1 1.000e+03 2.222e-01 1.000e+00 -80.96° 0.00°
2 2.000e+03 4.975e-08 2.239e-07 4.55° 85.51°
3 3.000e+03 3.323e-08 1.495e-07 3.04° 83.99°
4 4.000e+03 2.494e-08 1.122e-07 2.28° 83.24°
5 5.000e+03 1.995e-08 8.978e-08 1.82° 82.78°
6 6.000e+03 1.663e-08 7.483e-08 1.52° 82.48°
7 7.000e+03 1.426e-08 6.415e-08 1.30° 82.26°
8 8.000e+03 1.248e-08 5.613e-08 1.14° 82.10°
9 9.000e+03 1.109e-08 4.990e-08 1.01° 81.97°
10 1.000e+04 9.981e-09 4.491e-08 0.91° 81.87°
11 1.100e+04 9.074e-09 4.083e-08 0.83° 81.79°
12 1.200e+04 8.318e-09 3.743e-08 0.76° 81.72°
13 1.300e+04 7.678e-09 3.455e-08 0.70° 81.66°
14 1.400e+04 7.130e-09 3.208e-08 0.65° 81.61°
15 1.500e+04 6.654e-09 2.994e-08 0.61° 81.56°
16 1.600e+04 6.239e-09 2.807e-08 0.57° 81.53°
17 1.700e+04 5.872e-09 2.642e-08 0.54° 81.49°
18 1.800e+04 5.545e-09 2.495e-08 0.51° 81.46°
19 1.900e+04 5.254e-09 2.364e-08 0.48° 81.44°
20 2.000e+04 4.991e-09 2.246e-08 0.46° 81.41°
21 2.100e+04 4.753e-09 2.139e-08 0.43° 81.39°
22 2.200e+04 4.537e-09 2.042e-08 0.41° 81.37°
23 2.300e+04 4.340e-09 1.953e-08 0.40° 81.35°
24 2.400e+04 4.159e-09 1.871e-08 0.38° 81.34°
Total Harmonic Distortion: 0.000035%(0.000000%)
Date: Mon Jul 13 20:21:25 2020
Total elapsed time: 16.156 seconds.
Attachments
I am by far to reach 0%. This character is paramount importance on this website, as members give full credibility to values presented by this gadget.
"this gadget"
I use the tool described here:
LTSPICE THD Analyzer
It bundles up all the usual settings and does frequency and amplitude stepping as well if desired.
LTSPICE THD Analyzer
It bundles up all the usual settings and does frequency and amplitude stepping as well if desired.
Do it like you would do in real life with hardware: At first do a null measurement of your bare signal source. Then you will see the limits of your simulation.
I 100% agree with you that this is the way a designer should proceed. Because besides numbers, the designer can see the type of nonlinearity whether crossover ,slew rate , saturation etc. On the other hand as the fundamental is decreased considerably , than the measured distortion can be estimated with much higher precision. As LT is programmable, I will see how to create a subtracting amplitude/phase automatically.
I use the tool described here:
LTSPICE THD Analyzer
It bundles up all the usual settings and does frequency and amplitude stepping as well if desired.
It looks LT can get plugins, or addons. I wonder if there is a website regrouping all such accessories.
Thank you 808eengr to put me on the right track.
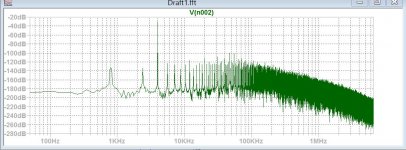
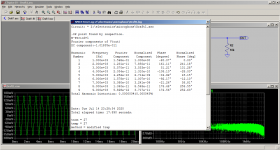
I followed the instructions given by Mooly precisely identical, I get this.
Hayk
increase .delaycycles= parameter to allow the system to settle, or set to 0 to see the initial system response
use pulse input for unit step
not sure if delta dirac input is possible, perhaps use femtosecond, since LTspiceXVII param .numdgt handles 15 easily with modern CPU
ltwiki.org is a good resource with comprehensive info
.OPTIONS -- Set simulator options
Last edited:
Perhaps if you actually showed us the circuit that you are simulating? In general LTspice will give you much lower distortion than what you would get in real life. So I would be concerned about the circuit that is producing that result 😉
Tony.
Tony.
Attachments
Last edited:
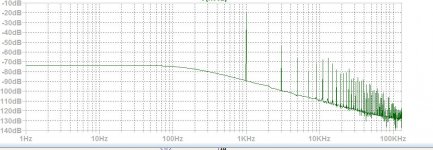
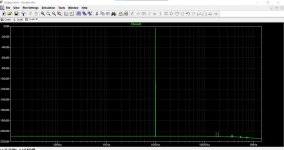
It is the same circuit without 10k. The last measurement I followed the instruction at 4khz. When I look your FFT , sure, I am not doing what should.
Ian Heggulen told me LT can export the result in .wav format. I wonder if the FFT of Arta
or other ,can be put into use.
What makes me happy, I applied same type of measurement on Tina using the scope. After letting run several seconds in Normal trigger mode with about 50 cycles visible, I stop it and write the data on signal viewer. I just got the knowledge that the signal can be selected and fourier analysis can be operated. The calculation is instant and straight forward ,very precise.
Last edited:
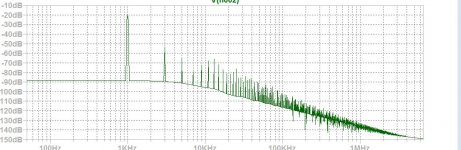
Even without the 10K resistor the result is pretty much the same. Take out the .options plotwinsize=0 however and it starts to look more ugly.
I don't know why you have the drooping noise floor though...
Tony.
I don't know why you have the drooping noise floor though...
Tony.
Can you give your way of adjusting the simulation/FFT as Mooly does. I am sure many other members will be also thankful.
Hayk
Hayk
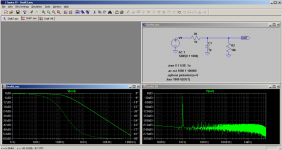
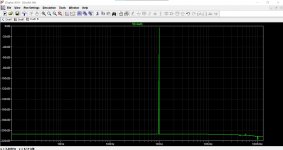
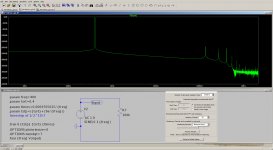
Here is an ultra low distortion FFT at 1kHz and 10kHz.
Attachments
-
 Annotation 2020-07-14 184259.jpg121.4 KB · Views: 301
 -
 Annotation 2020-07-14 183801.jpg254.4 KB · Views: 333
 -
 Annotation 2020-07-14 183958.jpg138.7 KB · Views: 353
 -
 Annotation 2020-07-14 183632.jpg251.8 KB · Views: 341
 -
 Annotation 2020-07-14 184357.jpg198.4 KB · Views: 312
 -
Draft1.asc549 bytes · Views: 148
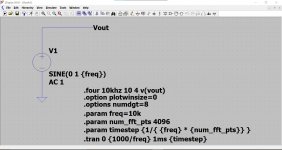
The attached works well here. Normal operation is to only adjust parameters:
freq = oscillator frequency
tsrt = time top start data capture
Note the oscillator frequency is locked to {freq}. The rest automatically calculates time step and simulation stop time against frequency based on reasoning long forgotten. The results are close enough for government work. The Spice error log for 'input' looks like:
Total Harmonic Distortion: 0.000000%(0.000000%)
Attachments
- Home
- Design & Build
- Software Tools
- how to measure precisely distortion with LTspice?