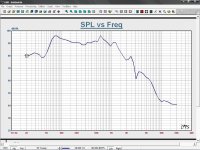
I am new to LMS. I got two graphs for vented box. The box have port on the opposite side of woofer cone. i.e. exactly opposite direction.
I have taken two frequency response graphs. Now guide me how to get one graph by cobining?
The woofer graph is taken at .5 inch from centre of the woofer.
The port graph is taken at the centre & at the port end point.
Guide me in the matter.
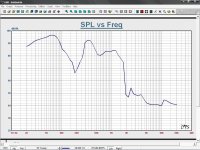
I have taken two frequency response graphs. Now guide me how to get one graph by cobining?
The woofer graph is taken at .5 inch from centre of the woofer.
The port graph is taken at the centre & at the port end point.
Guide me in the matter.