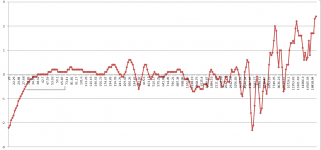
If I plot my emm-6’s calibration file on a chart this is how it looks like.
You see those wild swings in the high range and some from –ve to +ve. I would like to understand how does ARTA apply such a calibration file to smoothed (1/3, 1/6,.. octave) as well as unsmoothed measurements ? Does it apply the calibration to the raw measurement or the final displayed measurement ? How does it handle measured points that happen to fall between the calibration file points ? Below is a snippet of the file. So what compensation would it apply to a point that is between -
9888.89 -0.6
10160.44 0.2
Or between –
14846.3 1.1
15253.97 0.6
Calib file sections -
-----
9117.03 1
9367.38 0.3
9624.61 -0.7
9888.89 -0.6
10160.44 0.2
10439.44 0.4
10726.1 0.4
11020.63 1
…
…
12965.66 2.2
13321.69 1.8
13687.5 1.6
14063.35 1.6
14449.52 1.6
14846.3 1.1
15253.97 0.6
15672.84 0.9
16103.21 0.6
16545.39 0.7
16999.72 1.4
17466.52 0.8
17946.14 1.7
18438.94 1.7
18945.26 1.7
19465.49 2.3
20000 2.4
Attachments
You can view the graph of the interpolated compensation right in FR compensation dialog. That is covered in the manual.
P.S. I just noticed you can't resize the window for some reason, but you can click the copy button to copy a large size to the clipboard.
P.S. I just noticed you can't resize the window for some reason, but you can click the copy button to copy a large size to the clipboard.
Last edited:
Hi Percy, though the best answer would be from the author, looking at my calibration and results, the calibration file appears to be interpolated to the measurement.
Percy, your ECM-8000 is really quite flat - almost doesn't need a cal file. Certainly has way better bass response than mine.
That emm-6 cal file looks suspicious. There is way too much going on there for such a simple device. Maybe compare it to your behringer mic measuring a tweeter?
That emm-6 cal file looks suspicious. There is way too much going on there for such a simple device. Maybe compare it to your behringer mic measuring a tweeter?
@dumptruck:
The fr comp graph in arta is partly to blame for the confusion. It basically just added points between those wild peaks and dips. There is practically no difference in the shape of the curve.
I also downloaded another random calib file from dayton's website and it had the same characterisitics. Not sure if dayton's calibration method or file is flawed but I just expected to see a smooth rising or falling curve and not those crazy swings all over.
@Ron:
I remember having done some comparision measurements with the ecm8000 and while it escapes my memory what was the exact outcome I dont remember my ecm8000 to be flat above 8khz though. I somehow remember it as having lower response above 8khz than then emm-6. I will do that test again with and without compensation.
Interpolation is normal processing proc., and yeah, they look comparable.@dumptruck:
The fr comp graph in arta is partly to blame for the confusion. It basically just added points between those wild peaks and dips. There is practically no difference in the shape of the curve.
I don't think there isn't anything that crazy about it for the highest frequencies... AFAIK, Dayton still hasn't told anybody what their calibration procedure is, so nobody can really judge unless they want to pay for a certified calibration (which would be crazy). The cross spectrum guy posted some comparisons to his measurements years ago, which I just managed to drag up in google: http://www.htguide.com/forum/showth...mes-calibrated&p=472257&viewfull=1#post472257I also downloaded another random calib file from dayton's website and it had the same characterisitics. Not sure if dayton's calibration method or file is flawed but I just expected to see a smooth rising or falling curve and not those crazy swings all over.
I never figured the Dayton calibration to be accurate down to these sub-decibel scales, but anyway I just looked through some old nearfield measurements done with that mic (figuring there should be some nice smooth pistonic driver behavior), and the little ripple ~200-500Hz in my cal. file does show up in the measurements. :shrug:
- Status
- Not open for further replies.
- Home
- Loudspeakers
- Multi-Way
- How exactly does ARTA apply mic calibration file to measurements ?