I'm totally new to speaker testing, though I've tested many other things over the years & have some basic equipment.
I am currently experimenting with changing my 2X 12" BR subs to push-pull.
Audibly, I like the change, but it's much more subtle than I expected, so I'd like to do some actual measurements. (Plus, you guys might find it interesting.)
Obviously, I'm on;y looking at the 2nd harmonic.
Can someone possibly lay it all out for me: What software, what hardware needed, etc?
And do I sweep a sinewave, or use pink noise / white noise?
THANKS !
Harmonics and harmonic distortion is such a huge part of most pop music recordings that subtle distortion differences can be quite hard to detect. Using sine waves makes the differences more audible than with most types of music.
Distortion testing is done with one or more sine waves, or a swept sine wave.
Distortion testing is often done with REW, a free program using a swept sine wave signal. It gives separate graph lines for the various orders of distortion. There are on-line tutorials available for all of it's measurement capabilities.
Alternatively, you can use individual sine wave tones and a RTA to see the individual harmonics, then determine the % distortion for each. Slow, but the graphics are more telling than the usual "squiggly line" of REW or similar programs.
Using multiple non-integer tones can really separate the "wheat from the chaff".
Every speaker has a unique distortion signature at different drive levels, limiting your investigation to only a single harmonic would tell you very little.
Post 1 has a table with % compared to the distortion harmonic level in dB down from the fundamental (1st harmonic). Post # 3 & 4 shows examples of what distortion looks like on the Smaart RTA:
Push Pull vs Normal Distortion Compared
Cheers,
Art
Every speaker has a unique distortion signature at different drive levels, limiting your investigation to only a single harmonic would tell you very little.
Yup, that's why I like using REW and a swept signal for measuring THD. The unique distortion signature shows up in the shape of the distortion curves for even and odd-order harmonics.
Post 1 has a table with % compared to the distortion harmonic level in dB down from the fundamental (1st harmonic). Post # 3 & 4 shows examples of what distortion looks like on the Smaart RTA:
Push Pull vs Normal Distortion Compared
That's actually a good example of where an REW swept measurement might have been more illustrative of the advantage of a PPSL layout. The reduction in even order distortion across the passband could readily be ascertained from the corresponding curve in the measurement.
Attachments
Thanks, guys. I'll check out REW in the next few days.
One update: I realized a few things today, re-listening and recording results:
1: The source audio is critical. I originally used a loop of some Deadmau dance groove, but it has so much distortion in it already that it minimized my results.
2: I wasn't listening at loud enough levels.
3: The P-P configuration is not as loud, so level matching is critical.
Today I used a much cleaner loop (Bee Gees) and went to the edge of the plate amps' limiting. The difference was MUCH more noticeable. There is just no doubt that I vastly prefer the P-P sound.
I will still be testing them correctly as soon as I can, but I'm convinced enough that I'm now working out a way to mount 1 driver backwards, with just its magnet sticking past the speaker face. This will still fit behind the grill, and not take up too much internal volume, the way I'm planning it.
It will be tricky, but it can definitely be done, as a 12" driver will JUST make it through the opening that the plate amp sits in.
(Note: for my current test, I simply mounted 1 driver on the outside, out of phase with the wires coming out of 1 port. Good enough for a quick test.)
Details and results to follow ....
Last edited:
Thanks, guys. I'll check out REW in the next few days.
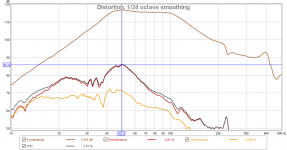
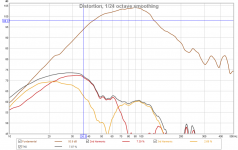
If you test a number of different subwoofers with REW, you start to notice a few things about how the type of alignment impacts the distortion profile. The previous graph that I posted was that of a 4th order BP alignment tested close to its limits. You'll notice that the THD curve peaks around the lower end of the passband. I suspect that the vented section of the design is doing a good job filtering out the distortion components as frequency is increased. For the one I've attached here, that's an isobaric 4th order BP enclosure driven close to its limits (actually the "limit" here being its behavior below the passband because it was still measuring pretty clean within the passband itself). Note how the THD "profile" has changed? The hump is now moved outside of its passband. From 50 Hz up, the distortion is extremely low, like 1.25% or lower. The isobaric mounting seems to have reduced the distortion even further. Comparing these to the profile of a vented/MLTL system (the second attachment), it's clear how different the distortion profile is, with the latter showing much more distortion at higher frequencies. It's often been said that with bandpass enclosures, it's difficult to hear when the drivers are under stress and you can end up destroying the drivers by thinking you can keep feeding them more power. These profiles support that P.O.V.
Attachments

- Status
- Not open for further replies.