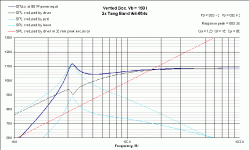
You have two Tang Band 4 inchers in a ridiculously large enclosure, tuned far too high. That is why you have the huge peak just before cutoff.
Since there are 28.3 Liters in 1 Ft³, this enclosure is 5.3 Ft³! That is big enough to fit a 15 incher into, instead of two 4 inchers.
I suggest either a sealed box with 13 Liters, or a ported box with 19 liters tuned to 50 Hz.
See if the dark blue line doesn't look better. That is, a flat line all the way down, untiil it turns downward for the cutoff.

That looks much better. I usually play around for a while until I get something pretty flat, with as low a 3db point as possible without compromising the flatness too much. It's interesting to change things like the port length, or box volume, just to see how it afects things.
Have fun 🙂
Regards,
Tony.
Have fun 🙂
Regards,
Tony.
Don't forget that appropriately coloured red line cutting through the graph! This show that the drivers have reached max linear excursion (xmax) at ~175Hz. So at 80w input, flattening out the bottom octaves by changing box volume, tuning etc. makes no difference.
Alter the power handling figure until you find a point where the red line does not intersect with the black line within the required range (or using the second Unibox graph might be easier - peak cone excursion graph).
Alter the power handling figure until you find a point where the red line does not intersect with the black line within the required range (or using the second Unibox graph might be easier - peak cone excursion graph).
- Status
- Not open for further replies.
- Home
- Loudspeakers
- Multi-Way
- help interpreting graph