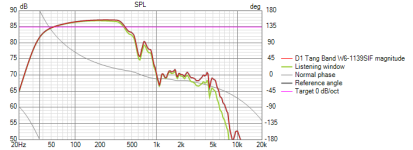
Hi everyone,
I was making a design for a two ways crossover on vituixcad. For the tweeter I opted for the Peerless XT25TG30-04, 4 ohm nominal impedance, and for the woofer the SDS-P830657, 8 ohm nominal impedance.
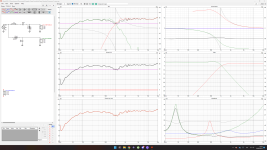
In the picture of the crossover scheme to me impedance looked fine, reaching a minimum of 4.0 Ohms at about 2100 hz frequency.
Minor corrections aside, I could not find any way to fix the 3-4 db peak at 1000-1200 hz, to make the whole responce almost flat.
I'm open to suggestions to fix this issues or other things I could not notice.
Thanks in advance
(pics of the crossover and graphs together with frd and zma files are attached)
Attachments
It shows up in the factory measurement, so scaling the driver to find the DC size it appears to be an eigenmode, so tack on a felt/open cell 'button' in the center or a ring of it around the glue joint to either fix or eliminate one possibility.
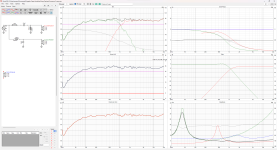
Eventually I inverted the tweater and fixed the dip at 1000 hz. As for now the frequency response looks flat enough to me, and impedance does not ever get below 4.2 Ohms which seems fine. The phase of the two drivers is quite close now too. Thanks for the advice! I put graphs and crossover down below in the attachments if anyone else is interested!
Attachments
I am a bit concerned that the chosen crossover frequency of 1000 Hz is quite low for a 25mm tweeter. Won't this reduce the amount of power that the loudspeaker system can safely handle?
You might be right, I read it could need too much of excursion from the tweeter and might damage it. I'll try tweaking more and see if I can cross it at around 2000 Hz, thanks!
From the circuit diagram that's been provided, I've noticed that the woofer and the tweeter are both coincident, located at (X,Y,Z) = (0,0,0). It would possibly be helpful for the initial design if at least the vertical separation between the drivers was included. Having done that, you would also need to choose a listening axis, which is often set to be the tweeter axis. Of course, depending on how the loudspeaker system is to be used, you might opt for a different axis.
Member
Joined 2003
The bump or 1kHz crossover is the least of the problems here. Traced manufacturer graphs with no processing of diffraction for the cabinet it's going in, no phase information, no driver coordinates, etc. Means that the wiggly lines here are just wiggly lines with very little correlation with reality. Maybe okay just to see the interaction of adjusting crossover components, but not something that should be built.
Besides that, I would recommend 2.5kHz+ crossover for XT25TG30, unless you install it in a waveguide, in Visaton WG148 it can perform well down to 2kHz.
Besides that, I would recommend 2.5kHz+ crossover for XT25TG30, unless you install it in a waveguide, in Visaton WG148 it can perform well down to 2kHz.
I didn't notice that there was no phase information in the FRD and ZMA files. You've pointed out a major issue. I did wonder how such excellent-looking filter response functions had been obtained with such simple high-pass and low-pass filter networks. The purely resistive nature of the driver impedances, and the lack of driver phase response information, go a long way to explaining that!
I thought phase was something obtainable from frd and zma files already, but now that I connect the single drivers I see that phase information is completely absent thank you for making me notice! Then, where am I supposed to find informations about phase? On the manufacturer's sheet from Peerless there's on axis response, 30 deg and 60 deg response and impedance. Should I merge the three responses together in a unique file?
Also I did not notice both woofer and tweeter were positioned to 0 in the three axis, I'll change the positions too and see the difference. So when thinking on the positioning of the drivers it means the position compared to my listening position or else?
For the diffraction processing I will look for more information on how to do it. Thanks everyone
Last edited:
The phase response for impedance and sound pressure responses can be estimated from the magnitude-only response data. The process involves assuming that an individual loudspeaker driver is a minimum-phase transducer, which in many instances is a reasonable sort of assumption.I thought phase was something obtainable from frd and zma files already, but now that I connect the single drivers I see that phase information is completely absent thank you for making me notice!
VituixCAD has a feature that traces a magnitude response curve, and which also automatically computes the (minimum-phase) phase response from the curve that has been traced. It's located under the Tools-->SPL Trace command. Although called SPL Trace, it handles both SPL and impedance data with equal aplomb.
In the absence of measured SPL and impedance response data that includes the phase response, the SPL Trace method should get you in the right ballpark.
I believe that you will need three individual files. I would start by just including the file with the on-axis response. This should work reasonably well for situations where the chosen design listening point is not too far off axis, say ±5° or so. That would certainly be typical of larger listening distances, say 2 or 3 meters.On the manufacturer's sheet from Peerless there's on axis response, 30 deg and 60 deg response and impedance. Should I merge the three responses together in a unique file?
It will make a bit of a difference, due to interdriver time delays for sound reaching the design listening point. At 2kHz the wavelength of sound is approximately 172 mm, so 1/4 of that distance (43mm) results in 90° of additional phase difference between the outputs of the drivers at 2kHz. At 3kHz, that distance reduces by 50%.Also I did not notice both woofer and tweeter were positioned to 0 in the three axis, I'll change the positions too and see the difference.
It is necessary to specify the coordinates of the listening position, as well as the individual coordinates of the geometric locations of the woofer and tweeter on the baffle to have any chance of getting a reasonably accurate simulation of what's happening.So when thinking on the positioning of the drivers it means the position compared to my listening position or else?
A while passed and I tried taking the steps properly now. I changed the tweeter with the Peerless DX20BF00-04 and calculated the diffraction with an ipotetical 200 x 400 mm front baffle using the diffraction tool, checking full space and position of the tweeter on the baffle. For the woofer I still used the SDS P-830657, exporting the SPL from a 20 L sealed box as a starting point, then calculated the diffraction of the in-box response. Eventually I loaded the diffraction response files in the drivers section and started tweaking for a crossover. Mind that in the images i attached, the crossover is not really ideal and needs probably lots of changes, but so far what I am concerned about is if I am missing anything else to start modelling the crossover. I also checked the minimum phase for both drivers and wonder if that phase graph makes sense or not as well. I also set the positions on the Y axis of both the drivers and the room setup, image attached as well.
Am I taking the steps correctly this time to start modelling a crossover?
I will put the frd/zma files, the crossover and graphs and the diffraction files.
Am I taking the steps correctly this time to start modelling a crossover?
I will put the frd/zma files, the crossover and graphs and the diffraction files.
Attachments
-
Peerless SDS P-830657 Diffraction Files.rar482.1 KB · Views: 82
-
Peerless DX20BF00-04 Diffraction Files.rar489.1 KB · Views: 79
-
SDS-P830657.frd10.3 KB · Views: 92
-
SDS-P830657.zma8.1 KB · Views: 79
-
DX20BF00-04.zma14.5 KB · Views: 81
-
DX20BF00-04.frd8.4 KB · Views: 82
-
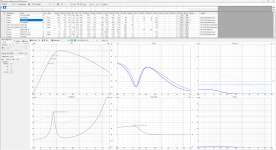 Woofer in the enclosure.png137.6 KB · Views: 109
 -
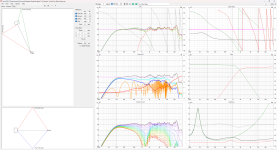 Room.png173.1 KB · Views: 99
 -
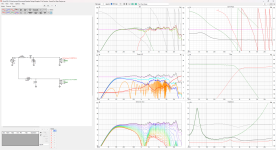 Crossover and graphs.png185.8 KB · Views: 104
I reviewed your project and I noticed that the files of the WF processed in diffraction tool are the ones generated with the enclosure tool and that is not correct. Also you have to use in the main program the Z file created by the Enclosure tool.
Find attached a quick and dirty simulation I made by using the on axis files only.

- Design your cabinet and save the SPL and ZMA files.
- In diffraction tool, generate baffle step files for the low part (at 3000 mm) of the WF. For the high part (typically at 1000 mm), create the off axis files by loading the the frd files for WF and TW by checking the directivity option.
- Open Merger tool and join the low and high frequency part you created (typically at 400-600Hz) for the WF.
- Input all the data in the main program.
Find attached a quick and dirty simulation I made by using the on axis files only.
Attachments
Last edited:
Thanks for your help! I quite understood the process, but I still don't get what you did in order to get the final woofer response. Also is there any way to get a merged response only for a single woofer, let's say a subwoofer to model?
Create and save your cabinet responses in the enclosure tool
Create and export a Low part diffraction response

Check full space and load the FRD file (don't forget to reduce the distance to 1000mm), check directivity (and vertical planes) and export the responses

Open Merger tool and load the responses you created, then save the FR as FRD files

The procedure is the same for every driver that needs a cabinet, subwoofer included.
Create and export a Low part diffraction response
Check full space and load the FRD file (don't forget to reduce the distance to 1000mm), check directivity (and vertical planes) and export the responses
Open Merger tool and load the responses you created, then save the FR as FRD files
The procedure is the same for every driver that needs a cabinet, subwoofer included.
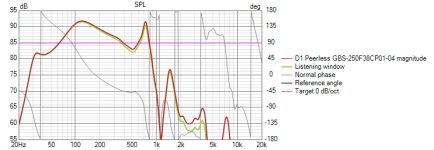
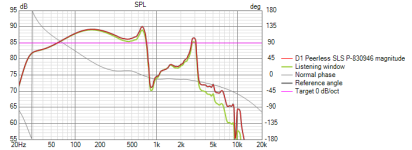
Thank you very much! I followed the instructions and was able to model 3 different concepts for a small subwoofer with three different drivers! Two are ported with a 12 L box, using the Peerless SLS P-830946 or the Tang Band W6-1139SIF, and one is a ported 10 L box with the Peerless Peerless GBS-250F38CP01-04. I will put the files if anyone is interested!
I will go on with that two way speaker design as well and see if I can make something nice!
Thanks everyone for the advice 😀
I will go on with that two way speaker design as well and see if I can make something nice!
Thanks everyone for the advice 😀
Attachments
- Home
- Design & Build
- Software Tools
- Help correcting small peak in two ways crossover design!
