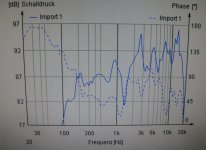
If you compare the frequency response between data sheet and my own measuring (DAAS3 NT) I note massive ripple at my own FE206EN devices (have a look to the attached files). There are no differences between all six devices, thus all devices comes from the same charge.
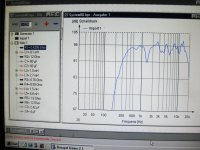
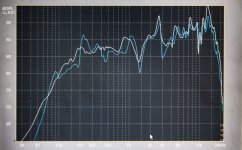
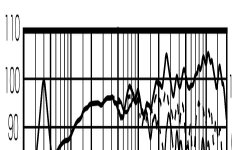
First image shows this full range driver at the enclosure from 5 liters (closed box) without any parts in front of the driver and last image shows an enclosure from 70 liters with 16 ohms in series (left channlel is the white curve, blue curve shows the right channel, both at a vented box). Both measurements shows the same behaviour between 500 and 3000 Hz. The cabinet sizes can not be the reason. Probably the not correct working cone creates this behaviour.
The question is now, whether that charge is faulty.
After correction with some passive devices with equalizer function ripple is strongly reduced, but the unwanted notch filter is only remove by the use of an equalizer with parametric adjustments.
The main question for me is, whether this measured frequency response is nominal and those from the datasheet was created by an use of a smooth operator.
The upload of various measurements from other diy projects with this full range model from FOSTEX provides for me more clarify in this matter.
Thank you for your efforts.
Attachments

Last edited:
Yes, the Fostex plot is smoothed -- probably 1/3 octave. It is also displayed on a 70dB axis. Your plot is displayed on a 20dB axis. There is no way to visually compare the two.
I know that lots of people demand unsmoothed FR plots "so they can see what is really going on". Yea, that's great, but your ears will smooth the FR to somewhere between 1/3 and 1/6 octave, and pretty much ignore sharp dips.. So if you want to see what you will hear, smooth the data to 1/6 octave and plot it on a 50dB axis.
The notch (this is not a filter, this is an artifact of the driver itself) at ~1750 is narrow enough an at the right place that you may well not hear it. Of far greater concern is the peak at ~2500. Your ears are rather insensitive to dips, but very sensitive to peaks. This you will hear.
Bob
Maybe you are partly right. The maximum at 1KHz and the Minimum at 1K2 is also to observe in the posted plot from post #2. But the now follow maximum not. To get the evidence for this estimate one must check the frequency response of this Fostex driver in an open baffle.Is your enclosure around 140mm deep internally?
I'd put money on a standing wave issue for the 1.2kHz dip.
Chris
If I provide the same results around the associated frequency area, the standing wave was create by the diaphragm itself.
If there are no way for passive correction, the needing of an active correction is wanted. Which circuit I need therefore (it must be an inverse notch filter) ??
Last edited:
I had a hunch that you are chasing a ghost. I spread the Fostex factory plot to roughly the same vertical scale as your measurement. Note that the peaks and dips are in nearly the same places. There are most likely differences in smoothing, but I can't fix that.
FR plots get real ugly when you expand the scales too much.
Bob
FR plots get real ugly when you expand the scales too much.
Bob
Attachments

- Status
- This old topic is closed. If you want to reopen this topic, contact a moderator using the "Report Post" button.
- Home
- Loudspeakers
- Full Range
- Fostex FE206EN 6 Devices with unwanted Notch Filter at approximately 1200 Hz