Im surprised you got it right the first time. It took me two days of trial and error trying different amount and placement of rockwool. My cabinet is also somewhat different, probably what would be called a damped u frame rather than resistance enclosure.
Well I'm sure mine can be improved. It's something I'll be looking into for sure. What kind of cardioid setup are you running and what issues did you have?

Cool. Where are you crossing over?
1,2KHz. Currently working on definitive version of cabinets. Sub will be multisub by 4 subs.
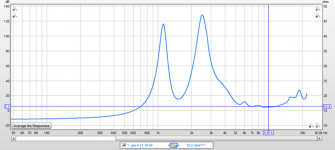
I was digging through my cable junk yard the other day to find some stuff for a different project, and ran across my impedance jig. I figured it's about time I ran some impedance sweeps of my waveguides. I'm a total noob when it comes to impedance and measuring it, so does this look viable? I've been looking at some stuff online and it seems reasonable. I think Earl mentioned a resonance at 6khz....which I guess is evident here with the little peak? Anything else amiss?
Attachments
Last edited:
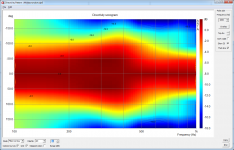
I forgot to add a legend for the FR plot...it goes 0-5-10-15-20-30-40-50-60-70-80-90-110-130-150-180. The contour plot is not normalized with 1/12 octave resolution. The FR plots are 1/24 octave.
Interesting construction! Can you provide a normalized and contoured polar plot (1/6 oct would be enough)? 🙂
FoLLgoTT - I will after work if I think of it, but I'll say right now that it isn't pretty! It's something like 40 degrees from 1-2khz then widening out to 90 IIRC. That notwithstanding I don't really see the use in displaying the data in a way that the speaker isn't actually being used.
With a cardioid you won't get much narrower dispersion. A cardioid has 180 degree dispersion (-6 dB at 90 degrees). Due to some directivity of the combination of driver and baffle you will get a little more directivity than that, but it's not much. Only when you get to the upper limit of the pass-band, will you get more directivity - solely because of the driver and baffle. Ideally you put the crossover where directivity of the cardioid box (which no longer behaves like a cardioid) and the horn match.
An externally hosted image should be here but it was not working when we last tested it.
FoLLgoTT - I will after work if I think of it, but I'll say right now that it isn't pretty! It's something like 40 degrees from 1-2khz then widening out to 90 IIRC. That notwithstanding I don't really see the use in displaying the data in a way that the speaker isn't actually being used.
I'm always looking for comparability. Most companys use normalized sonograms. Usually with +/- 90°, a level range of about 30 dB and contoured in 3 dB steps. Without normalization it is hard to read.
I always favour a linearized 0° axis. Your approach to compensate the directivity on the 0° axis may work in your room, but not necessarily in others, because it heavily depends on the frequency dependant reverberation time. In a heavily damped room such compensation fails. On the other side the directivity loses influence...
Nils - what manufacturers show normalized contour plots? I've seen contour plots on the K&H website but I don't remember seeing that they were normalized or not.
I'm not sure what it is you're saying about frequency dependent reverberation time. These speakers are meant to be toed in front of the listener, so I eq the listening axis so it's smooth with a bit of down slope at hf. If these had a nice constant polar like a SEOS wg for example then you could listen at any axis without having to eq the listening axis but unfortunately these didn't turn out as good. From my experience and what I've read a smooth response on the listening axis is most important. Changing the toe in changes the level of the side wall reflections, but as far as I know the reverb time in the room is the same whether I eq 0 flat or 45 flat. The 0 axis and 15 deg which is my listening axis are within about 2dB as it is.
keyser - I keep calling my woofer cab a cardioid but it's really not......I don't see that it follows any set pattern over any considerable bandwidth. It's just easier to say "cardioid" than "acoustic resistance" 😉. I do have about a 120deg horizontal pattern at 250hz which I think is pretty good.
Anyone have any thoughts on my impedance plot I showed on post 46?

Anyone have any thoughts on my impedance plot I showed on post 46?
They look perfectly reasonable and typical - there is not much to say.
Without normalization it is hard to read.
IMO with normalization is hard to read. One cannot tell the frequency response along any axis if the data is normalized. If not normalized then all axis are accurate.
Thanks for the normalized plot!
You are right. There is no statement. Maybe Neumann (former K+H) doesn't normalize their plots. But in this case it doesn't make any difference, because their 0° axis are ultra linear. Both diagrams would look the same.
I'll ask someone of the industry who created many of these measurements (Neumann, Genelec, Seeburg etc.). Maybe he can tell me how they were created.
Now I understand your equalization. You are listening under 15°. I thought you would listen under 0° and wanted to compensate the slightly colored diffuse sound field. I just misunderstood you. 🙂
I disagree. If I want to compare only the directivity of two speakers the normalized version is much easier to read. And in fact it is much closer to reality, because 0° should always be linearized when listening under this angle. It is the most important parameter to our ear.
The only exception is listening under different angles (like natehansen66). But in this case equalization of this different angle is just a workaround for a non-constant directivity. I don't see this as a typical use case.
Beside that a non-normalized sonogram can be misleading. In a normalized plot dips which occur only at 0° lead to a widening in directivity. This is correct, because for the directivity there is no difference between a widening caused by a dip at 0° or one caused by a bad waveguide or baffle wall diffreaction etc. The effect is the same.
The non-normalized plot on the other side hides the widening caused by dips. In my eyes this is some kind of cheating. 😉
Nils - what manufacturers show normalized contour plots? I've seen contour plots on the K&H website but I don't remember seeing that they were normalized or not.
You are right. There is no statement. Maybe Neumann (former K+H) doesn't normalize their plots. But in this case it doesn't make any difference, because their 0° axis are ultra linear. Both diagrams would look the same.
I'll ask someone of the industry who created many of these measurements (Neumann, Genelec, Seeburg etc.). Maybe he can tell me how they were created.
I'm not sure what it is you're saying about frequency dependent reverberation time. These speakers are meant to be toed in front of the listener, so I eq the listening axis so it's smooth with a bit of down slope at hf.
Now I understand your equalization. You are listening under 15°. I thought you would listen under 0° and wanted to compensate the slightly colored diffuse sound field. I just misunderstood you. 🙂
IMO with normalization is hard to read. One cannot tell the frequency response along any axis if the data is normalized.
I disagree. If I want to compare only the directivity of two speakers the normalized version is much easier to read. And in fact it is much closer to reality, because 0° should always be linearized when listening under this angle. It is the most important parameter to our ear.
The only exception is listening under different angles (like natehansen66). But in this case equalization of this different angle is just a workaround for a non-constant directivity. I don't see this as a typical use case.
Beside that a non-normalized sonogram can be misleading. In a normalized plot dips which occur only at 0° lead to a widening in directivity. This is correct, because for the directivity there is no difference between a widening caused by a dip at 0° or one caused by a bad waveguide or baffle wall diffreaction etc. The effect is the same.
The non-normalized plot on the other side hides the widening caused by dips. In my eyes this is some kind of cheating. 😉
A few minutes ago I got answer from Anselm Goertz who created many measurements and diagrams in the industry. He stated that all his plots are normalized to 0°.
Examples:
Neumann
Alcons
Bohlender-Graebener
Magazines like "Production Partner" and "Sound & Recording" (Test of a Genelec)
There is no standard for this kind of diagram though. Others who seem to normalize:
B&C
18Sound
Limmer
Seeburg
Examples:
Neumann
Alcons
Bohlender-Graebener
Magazines like "Production Partner" and "Sound & Recording" (Test of a Genelec)
There is no standard for this kind of diagram though. Others who seem to normalize:
B&C
18Sound
Limmer
Seeburg
Hi Nate, excellent build you got going here! I'm currently working on a passive-cardiod TD15M build too so its been handy observing your approach.
How far way are the baffles of your cabs currently from the front and side walls?
Have you noticed any improvement in the midbass/midrange region by going cardiod and/or a reduction in front wall reflections?
What software/computer hardware are you using for DSP and what is the resultant latency?
Are you running FIR or IIR filters?
Looking forward to more updates!
Cheers, Mark
Mark - the cabs are 2' off the side walls and 3.5' off the front wall. Heavy toe-in........about 45°. Unfortunately my room sucks. The left speaker is sitting by a large opening to my dining area and the room is only 11.5' wide on the short wall where the speakers are located.
As much as I'd like to say these are showing a measurable improvement in-room.....they don't as I recall. I had some comparison data of a TD in a sealed cab and my cardioid cabs in the same position but I can't find it right now. Maybe I'll do that again one of these days.
TBH if I was going to do this again I would do it with active side drivers rather than the resistance vents to get better control of the response and to shift the lf to monopole to not lose any efficiency down low. I've also learned of quadrupoles (which should be a narrower pattern)in my adventure here from some forum members and I'd like to try a mix of my resistance vents and an active driver on the back. I tried it briefly but didn't give it much time. That decreases the eff in the full bandwidth of the speaker if I understand it correctly so there's a trade-off. Basically I want an even narrower pattern below 1khz due to my funky room.
Subjectively I never did a head to head test of the sealed cabs vs. my resistance cabs and since I built a new wg at the same time these are completely different so I won't offer an opinion there. I will say that I am quite happy with these. The measured response off-axis isn't quite where I want it so there's room for improvement. I'm listening louder than ever now if that tells you anything
My PC is a 64-bit Acer Win8 box with an i5 processor. Pretty low end really. I'm using an Echo AudioFire 12 firewire interface for a DAC. Software is JRiver Media Center. The Echo FireWire Analyzer reports 23ms latency but it's not seeing what goes on on the PC side. How would I go about checking that? As is the latency is not so bad that I notice any lag with video.
I'm using IIR filters. I've played with FIR but I haven't given it much time. Last time I redid the xo I created a phase correction filter but I haven't really used it.
- Status
- Not open for further replies.
- Home
- Loudspeakers
- Multi-Way
- (Forward) Radiation Sickness - Big waveguide and cardioid