what is happening to increase the spl somewhat off axis vs on ?
Hi freddi,
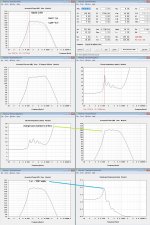
You have compared power response to off-axis pressure response. You need to compare on-axis pressure response to off-axis pressure response. In the attached example, the grey trace shows the on-axis (0 degrees off-axis) pressure response and the black trace shows the 15 degrees off-axis pressure response. As expected, the off-axis response is less than the on-axis response at higher frequencies.
Kind regards,
David
Attachments
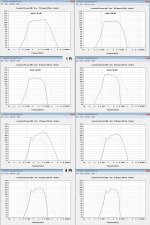
been up all night sick - here's an interesting comparison for the Fane 250tc
https://i.imgur.com/IvrnHOk.jpg
https://i.imgur.com/IvrnHOk.jpg
Thanks David - I'm sorry to consume so much of your time.
Hi freddi,
Not a problem - glad to be able to help out 🙂.
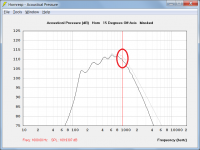
Just to complete the picture, under some circumstances it is indeed possible for the off-axis SPL to be greater than the on-axis SPL.
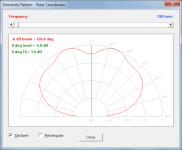
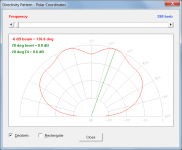
Attachments 1 and 2 show the directivity pattern for a test example conical horn radiating into 4 Pi space at 280 Hz.
Attachment 1 shows the level (-5.0 dB) and directivity index (3.6 dB) 0 degrees off-axis.
Attachment 2 shows the level (0.0 dB) and directivity index (8.6 dB) 20 degrees off-axis.
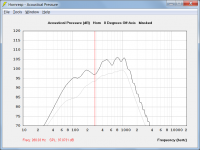
Attachment 3 compares the pressure response 0 degrees off-axis (grey trace) to the pressure response 20 degrees off-axis (black trace). In this case the off-axis response is 5 dB greater than the on-axis response, consistent with the directivity pattern results.
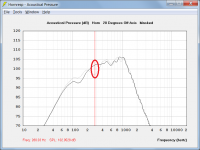
Attachment 4 compares the power response (grey trace) to the pressure response 0 degrees off-axis (black trace). In this case the off-axis response is 3.6 dB (the DI value) greater than the on-axis response.
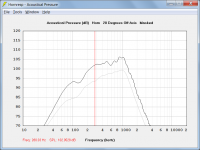
Attachment 5 compares the power response (grey trace) to the pressure response 20 degrees off-axis (black trace). In this case the off-axis response is 8.6 dB (the DI value) greater than the on-axis response.
Hope you are feeling better today.
Kind regards,
David
Attachments
Corrections
I should have said:
In this case the off-axis response is 3.6 dB (the DI value) greater than the power response.
I should have said:
In this case the off-axis response is 8.6 dB (the DI value) greater than the power response.
This is what can happen when you copy-and-paste words from other sections of text without thinking 🙂.
Sorry for any confusion caused!
In this case the off-axis response is 3.6 dB (the DI value) greater than the on-axis response.
I should have said:
In this case the off-axis response is 3.6 dB (the DI value) greater than the power response.
In this case the off-axis response is 8.6 dB (the DI value) greater than the on-axis response.
I should have said:
In this case the off-axis response is 8.6 dB (the DI value) greater than the power response.
This is what can happen when you copy-and-paste words from other sections of text without thinking 🙂.
Sorry for any confusion caused!
- Status
- Not open for further replies.