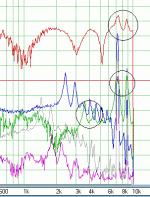
Hi all,
While H3, H4, H5 are "correctly" placed on 1/3, 1/4, 1/5 of i.e. the breakup frequency, it's not the case for H2 which is placed on the breakup frequency...
Why please?
Thanks
While H3, H4, H5 are "correctly" placed on 1/3, 1/4, 1/5 of i.e. the breakup frequency, it's not the case for H2 which is placed on the breakup frequency...
Why please?
Thanks
An externally hosted image should be here but it was not working when we last tested it.
Last edited:
No, it seems it's allways the case for H2, whatever driver or measurement software used...and H2 doesn't appear at F/2...There might be a secondary resonance at 2x H2 peak?
Perhaps the resonance of the cone is generating harmonics on its own.No, it seems it's allways the case for H2, whatever driver or measurement software used...and H2 doesn't appear at F/2...
I think 454Casull has it right.
Make a distinction between two different cases. For one case the woofer motor is making a fairly constant amount of distortion and the cone is radiating it. If the cone has a peak at 2k then the distortion also peaks at 2k but that might actually be the third harmonic of a 667Hz input. Distortion is following the frequency response of the cone but the curve is shifted to reflect the output frequency rather than the input frequency.
For the second case the resonance of the cone is the cause of the distortion. In that case the distortion peak will be alligned with the cone resonance, rather than a multiplication (division) of it.
David S.
Thanks guys for your input.
However all this matter isn't really clear for me; two astonishing examples from Zaphs site:
The L18; breakup begins at 7.2k (multipl peaks) and we can clearly see the first H2 peak at 3.6k:
http://www.zaphaudio.com/6.5test/L18-HD.gif
The W18EX001; breakup at 5k (lower Q than L18), no H2 can bee seen at 2.5k !
http://www.zaphaudio.com/6.5test/W18EX001-HD.gif
I measured my Accuton mid (breakup of relatively low Q at 10k) with ARTA and STEPS: no H2 at 5k, only the mirrored 10k resonance !
At this point my feeling is that huge undamped resonances let us see H2 at F/2 but on lower Q resonance the H2 level is so reduced that it doesn't translate into a peak...
Thanks guys for your input.
However all this matter isn't really clear for me; two astonishing examples from Zaphs site:
I think those examples are making my point. Especially with the L18, every mode is displaced downwards so that the harmonic number times the ditortion peak frequency gets you up to the fundamental curve's peak. That is, the double peak in the fundamental curve is seen at 1/5th that f in the fifth harmonic curve. In addition, the second harmonic curve shows the double peak at the same frequencies as the response curve. In other words it shows both: peaks due to radiation of the broad distortion trend, and it also shows distortion peaks due to the intensity of the modes creating the distortion.
From this I would say that nasty cone modes tend to generate 2nd harmonic distortion.
David S.
This tend to agree with my previous feeling about high Q broad resonance like those of the L18: its cone rings on a long time and almost on all the fr higher up its main breakup fr and thus generates H2 distorsion which can be seen on f/2 at 3.6 and 4.4kHz; other metal drivers such as the W18EX001 doesn't ring as high and long thus doesn't produce H2 distorsions...Maybe am I right...From this I would say that nasty cone modes tend to generate 2nd harmonic distortion.
- Status
- This old topic is closed. If you want to reopen this topic, contact a moderator using the "Report Post" button.
- Home
- Loudspeakers
- Multi-Way
- distorsion graphs
