I may be just a little dense here, but I need a little help wrapping my head around how to determine phase and gain margins in simulation. There are a few terms that I need to verify my understanding or lack thereof. I have books by Self, Slone and Cordell but still don't feel I have it totally straight.
1) Open Loop Gain (OLG) is the native forward gain of the circuit when there is no feedback being applied. Generally shows on a plot as having a very high gain and a narrow bandwidth, dependant on the amount of gain in each stage that is available. The gain drops off towards the dominant pole at -20dB per decade.
2) Closed Loop Gain (CLG) is the gain of a circuit where negative feedback is being applied. Generally shows a useful amount of gain for the real world and a relatively wide bandwidth. Gain will also drop off towards the dominant pole at -20dB per decade.
3) Loop Gain is where I get a little lost. This seems to me to be the amount of attenuation provided by the feedback network so that the OLG is reduced down to the CLG. In other words loop gain is the difference between the OLG and the CLG.
4) Gain Crossover Frequency is the frequency where the OLG=CLG
5) Unity Gain is where the gain (either OLG or CLG as they should be the same before get to this point) is 0dB
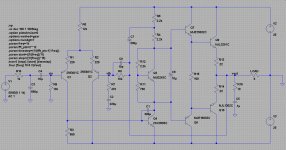
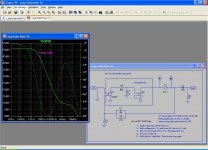
I have attached shots of a sample circuit (don't beat me up on it, it's just to get this issue straight in my mind). On the schematic I've labelled the input node, feedback node, and output node. I am determining my OLG and CLG gains algebraically as follows:
OLG=Output/(Input-Feedback)
CLG=Output/Input
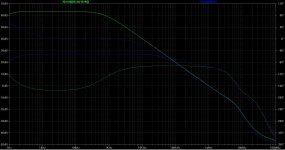
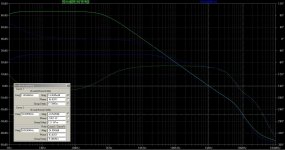
So from the plot, I have OLG as ~63.4dB and CLG as ~27.1dB and a Gain Crossover at 45kHz. I attached the cursors to the OLG plot and set the #1 cursor to a gain of unity (0dB) which occurs at 1MHz and the #2 cursor to a phase of -180 degrees which occurs at 10.6MHz. This suggests to me a healthy ~83 degree phase margin and an equally healthy gain margin of ~24dB. The Loop Gain is then ~36.3dB?
Have I done this correctly? Am I missing anything?
1) Open Loop Gain (OLG) is the native forward gain of the circuit when there is no feedback being applied. Generally shows on a plot as having a very high gain and a narrow bandwidth, dependant on the amount of gain in each stage that is available. The gain drops off towards the dominant pole at -20dB per decade.
2) Closed Loop Gain (CLG) is the gain of a circuit where negative feedback is being applied. Generally shows a useful amount of gain for the real world and a relatively wide bandwidth. Gain will also drop off towards the dominant pole at -20dB per decade.
3) Loop Gain is where I get a little lost. This seems to me to be the amount of attenuation provided by the feedback network so that the OLG is reduced down to the CLG. In other words loop gain is the difference between the OLG and the CLG.
4) Gain Crossover Frequency is the frequency where the OLG=CLG
5) Unity Gain is where the gain (either OLG or CLG as they should be the same before get to this point) is 0dB
I have attached shots of a sample circuit (don't beat me up on it, it's just to get this issue straight in my mind). On the schematic I've labelled the input node, feedback node, and output node. I am determining my OLG and CLG gains algebraically as follows:
OLG=Output/(Input-Feedback)
CLG=Output/Input
So from the plot, I have OLG as ~63.4dB and CLG as ~27.1dB and a Gain Crossover at 45kHz. I attached the cursors to the OLG plot and set the #1 cursor to a gain of unity (0dB) which occurs at 1MHz and the #2 cursor to a phase of -180 degrees which occurs at 10.6MHz. This suggests to me a healthy ~83 degree phase margin and an equally healthy gain margin of ~24dB. The Loop Gain is then ~36.3dB?
Have I done this correctly? Am I missing anything?
Attachments
Jason,
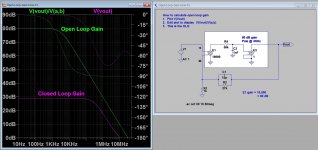
The attached files show how to get LTspice to plot `Open Loop Gain' and `Loop Gain'.
In the `Open-Loop-Gain2' file, the `Loop Gain' is the difference between the `Closed Loop Gain' and the `Open Loop Gain' (ie about 50dB).
Hope this helps,
Paul Bysouth
The attached files show how to get LTspice to plot `Open Loop Gain' and `Loop Gain'.
In the `Open-Loop-Gain2' file, the `Loop Gain' is the difference between the `Closed Loop Gain' and the `Open Loop Gain' (ie about 50dB).
Hope this helps,
Paul Bysouth
Attachments
This way works for me.
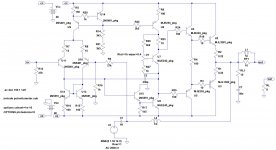
The big inductor disconnects the input and output for AC while keeping the DC conditions as they are supposed to be. If you simply remove the feedback resistor the circuit stops working because of DC imbalances. The big capacitor lets the test signal in, but keeps the ground connection from messing up the DC conditions.
I hope the above makes sense. If not, feel free to ask.
Attachments
Last edited:
I'm glad I'm not the only one! It would be nice to see one of the boards heavy hitters chime in to assist with cementing my understanding.
I know there are other ways to 'expose' OLG and this isn't the root of my question, but rather it is achieving the correct interpretation of the data once you have it. I'd love to hear from someone who really has a good handle on this stuff.
I know there are other ways to 'expose' OLG and this isn't the root of my question, but rather it is achieving the correct interpretation of the data once you have it. I'd love to hear from someone who really has a good handle on this stuff.
Jason
Hope this help;
You've almost got it except that the loop gain is the difference between the open loop and the reciprocal of the amount of feedback.
This reciprocal is not the same as the closed loop gain, but rather the inverse of the amount of voltage one would measure at the feedback node (to the summer) when the output is driven by a swept constant amplitude sinewave.
In your plot this feedback term would be the same as the closed loop gain you have plotted except that it would continue straight (horizontally) at the 25 db level.
Where this feedback and open loop cross, ~45KHz is the crossover frequency. That is the frequency at which the total gain going around the entire feedback loop is 1.
If you just plotted loop gain (in your case) it would look very similar to the open loop except shifted down such that it crosses 0db at 45KHz.
Closed loop gain and the reciprocal of feedback may be the confusing aspect, it might help to understand that the closed loop is the final response, a result of feedback applied to the open loop. In order for the negative feedback to "close the loop and produce the closed loop gain" there must be enough loop gain and when this loop gain is reduced to 1 (0 db) the loop must still have be negative feedback that is it must still have a phase less than 180.
-Antonio
OK, some of these comments are beginning to make some sense.
One thing I have to wonder about when dealing with the simulation and interpreting the plot for phase is the reference point. In the simulation the signal source has a constant phase of 0 degrees, no problem. The signal source, input filter and coupling are outside the feedback loop and so are the poles and zeros they create, yet we are still referencing everything against the source's phase, not the amplifier's input proper, the node labeled Vin. Should we not be taking the Vin node as our reference with respect to phase? Any phase shifts that occur to the signal prior to arriving at Vin are irrelevant insofar as the stability of the feedback loop is concerned, are they not?
One thing I have to wonder about when dealing with the simulation and interpreting the plot for phase is the reference point. In the simulation the signal source has a constant phase of 0 degrees, no problem. The signal source, input filter and coupling are outside the feedback loop and so are the poles and zeros they create, yet we are still referencing everything against the source's phase, not the amplifier's input proper, the node labeled Vin. Should we not be taking the Vin node as our reference with respect to phase? Any phase shifts that occur to the signal prior to arriving at Vin are irrelevant insofar as the stability of the feedback loop is concerned, are they not?
Jason
You are correct, the open "Loop" gain and phase refers to inside the loop (less the feedback network). Its easiest for me to think of 0 phase as where the feedback ends (open loop starts) but it's the same phase no matter where you start as long as you add all the open loop gains and phases together. Since your plot uses the error voltage as the reference all the external frequency depedancies the signal source has passed through have already been ignored. This open loop phase at the cross-over will determine your phase margin at least for resistive feedback. If there is any reactance in the feedback you'll need to add its corresponding phase. The reactance is one reason the post showing how to directly measure the loop gain (and phase) is so convienent.
Hope this helps -Antonio
I will "warm up" this cold thread. I'm also getting into spice (ltspice) and I am still not sure how to get proper measurement of phase margin.
I've been using this in some sims:
.ac dec 10 1 100Meg
.meas ZeroGainValue find v(out) when mag(v(out))=1
and I am not sure if this will give me what I'm really looking for. The output from this reads something like this:
zerogainvalue: v(out)=(-0.016956dB,-123.64°) at 4.37582e+06
But I'm not certain about how to properly interpret it.
I am assuming the phase is -123.64 in this reading, and I'm just guessing that this isn't the phase marin, as it's much too high to be correct, and it's negative, so although I'm not sure what to make of it, I'm thinking I should take 180 and substract that result from it, so this would be perhaps a phase margin in the vicinity of 56 degrees and change...
is this more or less how this works? Isn't there a way to get a straight reading that would be automatically calculated so I don't need to calculate it every time?
I don't often want automated calculation - you should be looking at the gain and phase Bode plot in addition to reading the numbers from the cursor as you move it to gain and phase intercept frequencies, looking at the curves few octaves before and after
a single number may hide a squirrelly response curve showing sharp resonance peak/dip which may be "real" or modeling error
and of course the .AC should only be used after you have debugged the circuit in .TRAN - with a t_max_time_step setting < the fastest device 1/ft
look at small 1ns rise square wave input response for ringing on the output, same applied to output through a nF C, change C load, superimpose test signal on full scale low frequency sine or triangle...
if the amp behaves in .TRAN with those tests - then you can be confident that the whatever the .AC stability test sign convention or phase unwrapping starting point of the Bode plot - you can just do the mental math to make sense of it because you know it is stable to start
Okay.. i figured i could waste a whole week trying to figure out the phase margin on my headphone amp and still end up with wrong value.. or ask here and be done with it (hopefully). This is tube headphone amp, but it should be irrelevant.
Basically i need to see if my amp is stable, at least in LTSpice (as the number of coupling capacitors frighten me).
I followed the method on LTSpice's audioamp.asc file to get the phase margin which is to short the input, break the negative feedback loop, insert an AC stimulus and plot what i believe is the loop gain as the ratio between the legs of the AC stimulus (the one connected to the load over the one connected to the negative feedback).
Here it is plotted..
1. Why the awkward graph? Why am i below 0dB around the audio 20Hz-20kHz frequency?
2. As shown above, i put the cursor where loop gain = 0dB, phase is -115deg. Does this mean my phase margin is 65deg (from 180deg-115deg)?
3. Most importantly, is it stable? I could DC-couple the feedback resistor to the output but that would introduce slight DC offset.
Transient simulation shows that it works. A 350mVpp source gets amplified to around 1.5Vpp.
Basically i need to see if my amp is stable, at least in LTSpice (as the number of coupling capacitors frighten me).
I followed the method on LTSpice's audioamp.asc file to get the phase margin which is to short the input, break the negative feedback loop, insert an AC stimulus and plot what i believe is the loop gain as the ratio between the legs of the AC stimulus (the one connected to the load over the one connected to the negative feedback).
Here it is plotted..
An externally hosted image should be here but it was not working when we last tested it.
1. Why the awkward graph? Why am i below 0dB around the audio 20Hz-20kHz frequency?
2. As shown above, i put the cursor where loop gain = 0dB, phase is -115deg. Does this mean my phase margin is 65deg (from 180deg-115deg)?
3. Most importantly, is it stable? I could DC-couple the feedback resistor to the output but that would introduce slight DC offset.
Transient simulation shows that it works. A 350mVpp source gets amplified to around 1.5Vpp.
An externally hosted image should be here but it was not working when we last tested it.
the plot doesn't look right - I don't know tube circuits well enough to offhand see what the phase splitter should do
guesstimating I'd also suspect the simple V probe at 10 MHz given the impedances, may actually need the Tian loop gain probe in this instance
if you posted the .asc, tube model the rest of us could play with it
guesstimating I'd also suspect the simple V probe at 10 MHz given the impedances, may actually need the Tian loop gain probe in this instance
if you posted the .asc, tube model the rest of us could play with it
I can't solve your problem, but I want to offer a couple of comments.
FB is left unconnected. Where did that go originally? to the right side of C7?
OUT to OUT appears to be the global feedback path. Why is it taken after the DC blocker on the output?
What is the DC voltage at the top of R20?
Is it different from the zero volts at the OUT?
R4+R8 does not equal R3. Does that affect the phase splitter gain?
Hi jcx and AndrewT,
Thank you for the reply. Attached is my .asc and tube model files.
I tried the Tian probe method but i guess i wasn't doing it correctly as it returned as error.
To answer some questions:
>> FB is left unconnected. Where did that go originally? to the right side of C7?
Yes, i tried both FB and OUT as the feedback point. Connecting to FB was an attempt to reduce coupling cap number inside the GNFB loop.
>> OUT to OUT appears to be the global feedback path. Why is it taken after the DC blocker on the output?
Yes, as shown above, OUT is the GNFB path. Is it wrong to take it after the DC blocker? Shouldn't GNFB path taken at the point where the load is?
>> What is the DC voltage at the top of R20? Is it different from the zero volts at the OUT?
I think i see where you're going with this question. You wanted to see if i can DC couple the feedback resistor, no? Unfortunately, top of R20 is not zero volt. It's positive and it's provides the bias voltage for the input tube. It's not unlike biasing DN2540 or LM317 as CCS.
>> R4+R8 does not equal R3. Does that affect the phase splitter gain?
The actual phase splitter load is only R3 and R4. R8 is bootstrapped to the output by C5. It equalizes the voltage drive swing between the upper and lower tube (note that the upper tube cathode is swinging along with the output voltage while the lower tube cathode is not). It stems from the problem that tubes are only N-type device. It will be clear once you find the time to run the .asc file.
Attachments
Hi,
I wanted to open this thread up again, to confirm that using LTSpice to measure phase margin can be accomplished as per the following link :
Negative Feedback, Part 5: Gain Margin and Phase Margin
The plot shows that the phase margin can be derived from the graph of :
V(out) * (V(feedback)/V(out))
If V(out) is the amplifier output at the point where feedback is taken, and V(feedback) is the input to the "opposing signal input LTP" of a classic LTP/VAS/OP stage amplifier, then can someone confirm that the aforementioned is correct ?
Is there a better way of using LTSpice to measure an amplifier phase margin simply ?
Thanks and regards,
Shadders.
Last edited:
Looks like some good info there. Will read that more thoroughly later...
But this doesn't seem to mention using a Tian probe.
Although after all these years always trying to get this kind of stuff done right, and having many explanations from various people, I too am still a bit fuzzy on exactly what to do.
I'e done this before and still I don't fully get it. There are cases where the Tian probe works very well, and many where it doesn't, and I don't know why.
Reviving this thread may be a good idea and get more and more proper explanations on how to do this right.
In any case, I don't know of any easier way to do it than with a Tian probe.
...There are cases where the Tian probe works very well, and many where it doesn't, and I don't know why...
What makes you think the Tian probe has not worked?
Can you show an example?
Best wishes
David
I haven't used this for some time and at the moment don't have a specific example to refer to.
However I did have issues on many occasions, for examples on bridges, such as the grounded source a la qsc, grounded bridge a la crown, whatever topo with nested loops... anything not using the "standard" single loop with miller inside gave me issues, with totally incoherent results.
As I understand the Tian probe, it shouldn't matter exactly where it's placed, as long as it's within the loop, but it's not always so obvious and I've tried many things before, not always getting at a proper result.
On a simple bridge, there are 2 loops really, so then where to insert that probe?
I don't recall right now, but I think an example with nested loops that gave issues is the leach. And an other example with nested loops, something based on Cherry's concept.
An other thing that can make it cumbersome when trying to read the margins on a plot, is when the response curve is chaotic, with peaks and dips... Not so clear cut to interpret that.
What I'd like is a straightforward way to do this, with a probe, but the results given in numbers directly in the log instead of fooling around on the plot, with those cursors not so easily placed, mostly due to the shortcomings of ltspice, where the only way to place cursors is drag them around, with no easy way to place them exactly where they need to be.
- Status
- This old topic is closed. If you want to reopen this topic, contact a moderator using the "Report Post" button.
- Home
- Design & Build
- Software Tools
- Determining Phase and Gain Margins in LTSpice