Hi,
thought to start a thread for Desmos, which is a graphic calculator and other visualization tools that are free to use, and quite powerful. Anything audio related like signals to aocustics related geometry can be plotted, and quite easily.
There are quite many links shared in the forums on some project specific threads. This thread shall be a place for anyone to share random stuff, ask for help, and so on. I'm not virtuoso with it, but have been able to do some fun experiments with it, perhaps able to help.
Not sure how much value there is eventually for anyone in practical DIY stuff, but at least it is fun way to take a dive into some concepts to get more insight and help develop some intuition on things.
Have fun!🙂
Main site:
https://www.desmos.com/
Graphic calculator: https://www.desmos.com/calculator
Geometry tool: https://www.desmos.com/geometry/
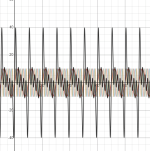
Ok here is simple superposition example, which I've just prepared in order to somehow try and study group delay and how it affects amplitude peaks.
https://www.desmos.com/calculator/4dbrl8lin0

It plots few sinewaves, a fundamental frequency and then four harmonics for it. There are controls to change amplitude and phase of the things, and intention was try to kind of visualize how the sines sum making huge amplitude peaks with fundamental period, which is supposedly something hearing system utilizes to detect pitch for example, and determine if sound source is close or not. See David Griesinger work on auditory proximity, look for paper "LOCALIZATION, LOUDNESS, AND PROXIMITY" for example.
I'm not sure if the sim is right as I'm not a math wizard, so please comment if there are some mistakes. It is quite simple, there is function to approximate some group delay, but I do not know how to make group delay of some ideal LR filters for example.
Anyway, still there are some fun tests to figure out:
-what constant group delay does
-what if group delay is constant to wavelength
-how easy it is to make a complete mess
-inspect effect of individual harmonics, like phase of 3rd harmonic alone, and with precense of other harmonics
-how much amplitude is increased with the harmonics aligned, misaligned
-perhaps something else?
Anyway, not sure if there is anything to learn here. My idea was to try and figure out audible effects of group delay to be able to come up with a listening test perhaps, in context of auditory proximity.
https://www.desmos.com/calculator/4dbrl8lin0

It plots few sinewaves, a fundamental frequency and then four harmonics for it. There are controls to change amplitude and phase of the things, and intention was try to kind of visualize how the sines sum making huge amplitude peaks with fundamental period, which is supposedly something hearing system utilizes to detect pitch for example, and determine if sound source is close or not. See David Griesinger work on auditory proximity, look for paper "LOCALIZATION, LOUDNESS, AND PROXIMITY" for example.
I'm not sure if the sim is right as I'm not a math wizard, so please comment if there are some mistakes. It is quite simple, there is function to approximate some group delay, but I do not know how to make group delay of some ideal LR filters for example.
Anyway, still there are some fun tests to figure out:
-what constant group delay does
-what if group delay is constant to wavelength
-how easy it is to make a complete mess
-inspect effect of individual harmonics, like phase of 3rd harmonic alone, and with precense of other harmonics
-how much amplitude is increased with the harmonics aligned, misaligned
-perhaps something else?
Anyway, not sure if there is anything to learn here. My idea was to try and figure out audible effects of group delay to be able to come up with a listening test perhaps, in context of auditory proximity.
Last edited:
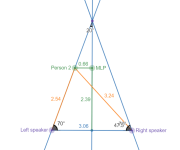
Here a simple helper to wonder about listening triangle:
https://www.desmos.com/geometry/7b6eq1whtn
See if there is kick bass with second person next to main listenin position with your positioning, or does it cancel out 🙂
Angles to help toe-in stuff, show listening distance, distances to speakers and so on.

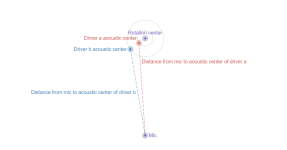
Here is simple demo how much error happens with spinorama measurement with common rotation axis, but with different acoustic centers.
https://www.desmos.com/geometry/p5ukhymtzz

Anyway, perhaps not something very useful in the end, but I think these are fun examples how one could use the geometry tool 🙂
ps. one can drag the points around with mouse, or use parameters on the left sidebar, there is even automation to have some animation going. I find this kind of real time stuff very valuable to get insight on things.
https://www.desmos.com/geometry/7b6eq1whtn
See if there is kick bass with second person next to main listenin position with your positioning, or does it cancel out 🙂
Angles to help toe-in stuff, show listening distance, distances to speakers and so on.

Here is simple demo how much error happens with spinorama measurement with common rotation axis, but with different acoustic centers.
https://www.desmos.com/geometry/p5ukhymtzz

Anyway, perhaps not something very useful in the end, but I think these are fun examples how one could use the geometry tool 🙂
ps. one can drag the points around with mouse, or use parameters on the left sidebar, there is even automation to have some animation going. I find this kind of real time stuff very valuable to get insight on things.
Last edited:
Wow, noticed there is a tone() function available, opens up possibility for audio!😀
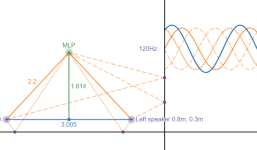
Here example, the above listening triangle demo adapted. Two walls added, then specular reflections from both walls from both speakers, and superposition both visualized and audible!😀 I made this experiment to evaluate if I could do something about null with my current setup around 120Hz just by tweaking the positioning a bit.
While this ignores room modes completely and has only two walls, it's just fun to experiment with and kind of have some indication of how reflections affect things.
Move the listening triangle around and see if you can calm down the superposition?🙂 By calming down I mean put animation on to the E parameter which makes a frequency sweep. You can hear a tone amplitude modulated, if you disable mute on top left speaker icon in the Desmos, try to make amplitude modulation minimal using positioning.
The listening triangle can be adjusted by dragging the points with mouse.
https://www.desmos.com/geometry/nzb0ta6nvm

Last edited: