Hello Everyone!
This is the first of several posts I’m going to make in this thread. This is the first time in a few years that I’ve posted on an online forum and will try not to make a mess of it.
Background
This is yet another DC-300A II refurbish experience that in my case was world’s easier than the Amazing Effort by Shawn 10 years ago. This is because I cheated and bought one that was already in good condition. It was sold initially to a home owner in Canada that made its way to the US, then finally to me a few weeks ago via FleaBay™. I spent (2) days on it and a couple of weeks deciding on and waiting for parts orders. The one thing that will be different about this post is that I’m a measurement nut. Audio, to a large extent, is a means to an end of empirical learning for me and if you’re foolish enough to follow along, I bet you too will see some stuff you haven’t come across before. 🙂
Though I’ve finished the refurbish, I haven’t listened to the amp yet. I was afraid to connect it to my loudspeakers prior to measurement and afterwards figured the "before" listening experience wouldn’t be indicative of a new OEM unit anyway. I’ll add a post to this thread in a week or so after doing some serious listening and see if this amp really earns its broken glass with good bass reputation.
Per Shawn’s and a few others comments both here and on the Crown Forum, and the good initial condition of the amp, I chose just to upgrade the electrolytic and ceramic disc capacitors and leave it at that. The 1N270 germanium diodes used in the limiting circuitry work properly, so I left them in place though I did buy spares for the future in case they become unobtainum.
OEM Parts to Upgrade
View attachment DC-300A II OEM.pdf
Replacement Parts
View attachment DC-300A II MOD.pdf
And for completeness, here’s a link to the Service Manual and the Owner's Manual.
Finally, as will be seen in following posts, what’s inside now matches the pretty outside:
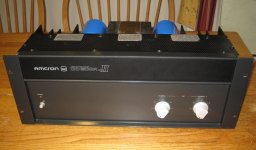


Part II - Going Inside
OEM Front
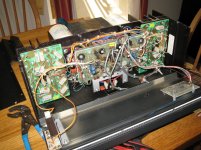
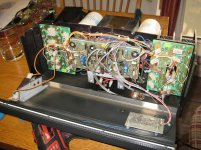
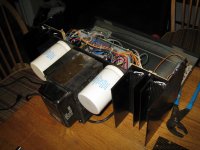
MOD Front
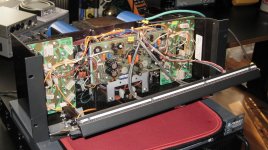
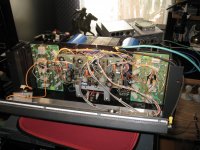
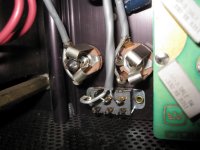
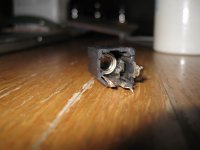
The (4) new black 22µF 50V bipolars that replaced the much smaller blue ones only clear the front panel by 1/16". Got lucky on that one. I could barely feel any resistance when inserting 1/4" phone plugs into the original input jacks even though they were in good shape, thus I replaced them with very grippy Switchcraft TRS units. I paralleled the Ring and Sleeve for exceptional ground contact.
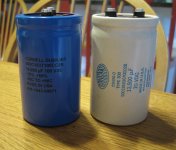
The large power supply capacitors were also up for replacement, which I expected would reduce ripple noise and possibly provide a bit more storage for bass transients (both of which proved true), but there was an unexpected benefit as well. The audible hum the amp made without being connected to anything was something I initially thought SOP for a large linear power supply transformer. Not so. After replacing the caps the hum virtually disappeared to my happy surprise. The new caps are a tad larger in capacity and voltage spec and a bit heavier, while dimensionally identical to OEM. I was even able to use the OEM attachment screws with the new caps.
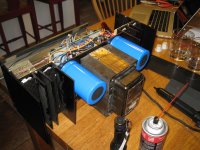
OEM Front


MOD Front


The (4) new black 22µF 50V bipolars that replaced the much smaller blue ones only clear the front panel by 1/16". Got lucky on that one. I could barely feel any resistance when inserting 1/4" phone plugs into the original input jacks even though they were in good shape, thus I replaced them with very grippy Switchcraft TRS units. I paralleled the Ring and Sleeve for exceptional ground contact.


The large power supply capacitors were also up for replacement, which I expected would reduce ripple noise and possibly provide a bit more storage for bass transients (both of which proved true), but there was an unexpected benefit as well. The audible hum the amp made without being connected to anything was something I initially thought SOP for a large linear power supply transformer. Not so. After replacing the caps the hum virtually disappeared to my happy surprise. The new caps are a tad larger in capacity and voltage spec and a bit heavier, while dimensionally identical to OEM. I was even able to use the OEM attachment screws with the new caps.


Part III - Measurements
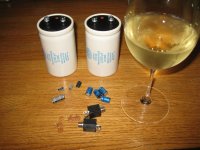
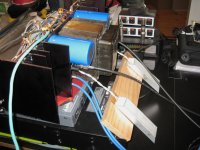
Discarded OEM Parts
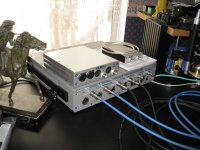
Measurement Tools and Connections
In my experience, nothing is quite as nice for electrical domain measurement as Audio Precision. In my opinion CLIO shares the same distinction in the acoustic domain (disclosure - I sell CLIO - so tread with care). Having both is a joy. Since CLIO has some unusual capabilities in the electrical domain, both are used in the following.
Crossover Distortion
When I received the amp I read the service manual and checked the bias voltages and they were in spec. DC offset was also in spec, but just barely. The upper plot in the following is what it looked like with the residual (everything that is not 1kHz) amplified by 60dB. The lower plot is the improvement made after adjusting the OEM DC offset trimmers and the 1kHz Bias trimmers I replaced the fixed "bias select" resistors with. Hopefully this will do away with some of the "broken glass" I’ve read about. 🙂
View attachment Crossover Distortion.pdf
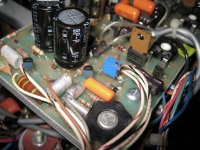
Here’s a close-up of the Bias Trimmers I added. Crown must have had quite a pot of fixed resistors to properly bias these things during manufacturing.
IOC Limiting
Before I get into the bulk of the before/after measurements, I’d like to discuss a single capacitor on the IOC board that controls the maximum output of the amplifier. OEM included an electrolytic (C8) that was marked 2.2µF at 50V, but measured 1.72µF. Since it was on my list of replacements (in this case a film capacitor), I thought the replacement’s 2.29µF value, being much closer to spec, would be helpful. Wrong. This single capacitor obviously forms a detection network that controls the limiting threshold voltage going to the output transistors. Crown must have hand selected it to achieve the proper rated output at manufacture. The result of the 2.29µF value caused the amp output into 4Ω to drop from about 300 watts to about 275 watts. Not a big deal, but interesting. I then changed the film capacitor to 1.76µF and the amp once again was able to generate the proper max output.
View attachment IOC Cap Affect.pdf
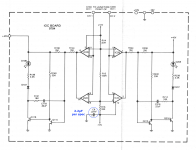
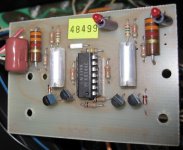
Here’s a picture of the IOC circuit from the service manual and a couple of pictures of the IOC board with the replacement capacitor. Another larger cap that barely fit, lucky again! 🙂
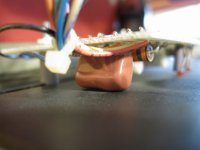
Discarded OEM Parts

Measurement Tools and Connections
In my experience, nothing is quite as nice for electrical domain measurement as Audio Precision. In my opinion CLIO shares the same distinction in the acoustic domain (disclosure - I sell CLIO - so tread with care). Having both is a joy. Since CLIO has some unusual capabilities in the electrical domain, both are used in the following.


Crossover Distortion
When I received the amp I read the service manual and checked the bias voltages and they were in spec. DC offset was also in spec, but just barely. The upper plot in the following is what it looked like with the residual (everything that is not 1kHz) amplified by 60dB. The lower plot is the improvement made after adjusting the OEM DC offset trimmers and the 1kHz Bias trimmers I replaced the fixed "bias select" resistors with. Hopefully this will do away with some of the "broken glass" I’ve read about. 🙂
View attachment Crossover Distortion.pdf
Here’s a close-up of the Bias Trimmers I added. Crown must have had quite a pot of fixed resistors to properly bias these things during manufacturing.

IOC Limiting
Before I get into the bulk of the before/after measurements, I’d like to discuss a single capacitor on the IOC board that controls the maximum output of the amplifier. OEM included an electrolytic (C8) that was marked 2.2µF at 50V, but measured 1.72µF. Since it was on my list of replacements (in this case a film capacitor), I thought the replacement’s 2.29µF value, being much closer to spec, would be helpful. Wrong. This single capacitor obviously forms a detection network that controls the limiting threshold voltage going to the output transistors. Crown must have hand selected it to achieve the proper rated output at manufacture. The result of the 2.29µF value caused the amp output into 4Ω to drop from about 300 watts to about 275 watts. Not a big deal, but interesting. I then changed the film capacitor to 1.76µF and the amp once again was able to generate the proper max output.
View attachment IOC Cap Affect.pdf
Here’s a picture of the IOC circuit from the service manual and a couple of pictures of the IOC board with the replacement capacitor. Another larger cap that barely fit, lucky again! 🙂


I repaired one, and modded another -- one of the issues to my thinking was that the heat sinks were not adequate for bias current into the sweet AB class.
They are beasts and relatively inexpensive.
They are beasts and relatively inexpensive.
That makes sense - I haven't actually had the opportunity yet to put this thing into use and see how it deals with real loads vs. heat. On the biasing, I noticed that once I got the ugly transition spikes to disappear that further twisting of the trimmer didn't make any measurable difference. My guess is that it was simply increasing bias, thus driving the transistors a bit harder, thus pushing the system toward a bit less efficiency and a bit more linearity.
I'm quite the newbie at this at present - my background is loudspeaker oriented. Some of the stuff I've read on this forum about folks building and upgrading amplifiers and preamplifiers is very impressive and quite a bit beyond me. 🙂
I'm quite the newbie at this at present - my background is loudspeaker oriented. Some of the stuff I've read on this forum about folks building and upgrading amplifiers and preamplifiers is very impressive and quite a bit beyond me. 🙂
Part IV - Measurements
Transfer Function and Peak Output
The following measurements show the low level frequency, phase and impulse response on the upper plot and something unique to CLIO on the lower plot - short term tone burst peak output. My technique is to make peak output measurements in the region that real music has real energy, i.e., under 10kHz. From 10kHz down to 100Hz I use an industry standard 1% THD as the "that’s all folks" threshold and from 100Hz to 10Hz I use 3% as is the reasonable trend of the industry at LF. You’ll notice that the slightly larger power supply capacitors did in fact lower the 100Hz to 10Hz distortion trace using the same drive level. Another observation is that I have never measured such a clean impulse response (and square waves and group delay) from any other amp. Frequency response down to DC makes this pure time domain behavior possible. Whether or not this results in an audible improvement is something I don’t have an opinion about yet, but the industry obviously decided a while ago that it doesn’t matter because you can’t buy audio amps that go to DC anymore AFAIK.
To better understand CLIO’s sinusoidal tone burst I used for peak output measurements, I chose the "slow" gated stimulus that is gaussian in shape and has a duration of about 13ms from HF down to about 300Hz. It then transitions to four wavelengths under about 160Hz. These short duration tone bursts allow max SPL measurements of loudspeaker drivers and systems without fear of thermal damage and allow amplifier maximum output measurements that reveal peak capabilities.
On the peak output plot you'll notice several traces. The ragged traces are THD as referenced on the right-hand vertical axis. The upper THD traces are from a swept sine stimulus which produces similar results as a standard long-term maximum output test. The lower THD traces are due to the short-term tone burst measurements. The centered straight line traces are output level in dBu as referenced on the left-hand vertical axis. The lower output level traces are from the swept sine measurements and the slightly higher output level traces are from the short-term tone burst measurements. These measurements were made into 4Ω and the +34.19dBu and +33.49dBu translate to 394 watts and 335 watts per channel respectively.
Attachment 574756
Intermodulation and Noise
The upper plot on the following PDF shows the reduction of intermodulation distortion due to the improved capacitors and bias trimming. The lower plot shows the the broadband noise spectrum from the amp with no signal applied. Both channels were virtually identical, so only the left is shown. The green trace is the post-modification result here and in the following measurements.
Attachment 574757
The final measurement shows the noise spectrum with 50Hz driven 1dB below clipping in the upper plot, and the lower plot is the same except at 1kHz. Kind of busy relative to a modern design, but the noise appears low enough to be quite acceptable in use. TBD.
Attachment 574758
Attachments
Last edited by a moderator:

I have changed the text as requested but now the attachments are only at the bottom, not part of the body of text.
I don't think the IOC circuit should have anything to do with the operation/power output of the amplifier, it is merely an indicator that there is a difference between the input and output, distortion.
Craig
Craig
I don't think the IOC circuit should have anything to do with the operation/power output of the amplifier, it is merely an indicator that there is a difference between the input and output, distortion.
I completely agree with you Craig on several counts:
1. The owner's manual indicates that the IOC circuit is purely show and tell.
2. The service manual indicates that the IOC circuit is purely show and tell.
3. The schematics show only the IOC opamp inputs connected to the audio circuit.
For some reason (probably aliens and sun spots), after I replaced the capacitors listed in the original post, multiple measurements consistently showed a reduction in about 25 watts max output into 4Ω. The 25 watts returned after I dropped C8 on the IOC board to nearly the same value as the OEM C8 cap. I chose the C8 cap because I was convinced that none of the others could cause this.* Again multiple measurements were made (with consistent results) because I was in full head scratch mode.
Personally, I'd stick to your guns and assume I messed up the measurements somehow. What I'm reporting makes no sense to me, but I'm a neophyte with electronics and simply reporting observations.
* BTW, every cap was measured for value and ESR using a Keysight (Agilent) 1733C LCR meter. I purchased (10) of every cap except the expensive power supply caps and matched them b/w left and right channels. I lucked out yet again with the power supply caps as each were within 1% of 16,500µF at 100Hz (the lowest my LCR meter goes).
Odd, that capacitor should just be a decoupler for the -10VDC supply for the LM339 comparator and the reference voltages for the comparator inputs.
Craig
Craig
As expected, you were right Craig. (C8) on the IOC board has no affect the behavior of the amp. When I woke up this morning I realized that I couldn't live without knowing what the deal was, so...
The first thing I did was remeasure the maximum output. Then I opened the amp up and soldered a parallel 1.8µF cap to the 1.76µF cap on the IOC board:
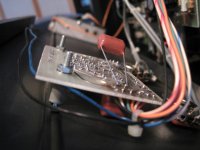
Then I ran the measurement again and got the same result. After removing the paralleled cap and reassembling the amp I measured a final time and again got the same result. BTW, this same result throughout this morning's tests were 50 watts (into 4Ω) short of the best results I got a couple of days ago of 300 watts.
Happily, the IOC LED's really work and let you know when the ugly begins.
Since this morning's tests were with the amp fairly cold, I heated it up to "quite uncomfortable" with a continuous sine and reran the test. Same result of 250 watts. So it's not about heat either.
It must be something goofy with the limiting circuit. Maybe those germanium diodes that everybody talks about. Something for future study, but in the mean time this amp is more than powerful enough to make my home audio system rip, so I'm going to start listening to it. 🙂
The first thing I did was remeasure the maximum output. Then I opened the amp up and soldered a parallel 1.8µF cap to the 1.76µF cap on the IOC board:

Then I ran the measurement again and got the same result. After removing the paralleled cap and reassembling the amp I measured a final time and again got the same result. BTW, this same result throughout this morning's tests were 50 watts (into 4Ω) short of the best results I got a couple of days ago of 300 watts.
Happily, the IOC LED's really work and let you know when the ugly begins.
Since this morning's tests were with the amp fairly cold, I heated it up to "quite uncomfortable" with a continuous sine and reran the test. Same result of 250 watts. So it's not about heat either.
It must be something goofy with the limiting circuit. Maybe those germanium diodes that everybody talks about. Something for future study, but in the mean time this amp is more than powerful enough to make my home audio system rip, so I'm going to start listening to it. 🙂
Does it look like normal clipping when using the 4 Ohm load? Symmetric or asymmetric? Those germanium diodes, D108/208, are only used in the negative phase VI limiters, so I would expect asymmetric results if those were bad. Every time I find a bad germanium device they are always leaky, always causing problems in the meter circuit of my BK1655 Variac. And as always if you do figure it out it will something stupid.
Craig
Craig
...And as always if you do figure it out it will be something stupid.
So true - except the stupid part is me, which I don't mind yet. 🙂 I'm a newbie with amplifiers and this little project has been quite enjoyable. With that said...
1. Clipping was and is nicely symmetrical at 4Ω and 8Ω.
2. I replaced the 1N270 germanium diodes with a pair I matched to 0.5V forward voltage drops at the rated 40mA current. I also tested the OEM diodes after removal and though unmatched, they were within spec.
It's the Bias, Stupid
Here's what I've concluded that I'm sure is common knowledge to the amp guru's around here: the variable responsible for changing the long term maximum output of the amplifier has been bias settings. Higher bias, less max output. Short term burst output is affected to a much lesser degree, which is a happy thing because I don't listen to sine waves anyway.
If I bias to the service manual's specs I get the nasty crossover distortion per the plots in my earlier post. I also get a cool running amp while quiescent that will probably last for several more decades. I also get higher output with EDM mixed with breaking glass.
If I increase bias to remove the nasty crossover distortion I get an amp that runs warm at rest that won't last as long. I also get the same perceived SPL with the wide dynamic range music I listen to without the glass. Hopefully. This post still doesn't include listening tests but does conclude the measurement sessions.
OEM bias specs are 0.31V to 0.35V across the pair of 5.6Ω 1W resistors on the output boards:
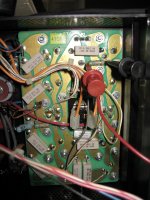
The bias levels required to remove the crossover distortion was about 0.50V. Quite a bit higher, but the amp runs reasonably warm and there are no signs of thermal runaway even when approaching thermal shutdown during max output testing. I noticed that I could remove crossover distortion with lower bias levels at 8Ω than at 4Ω. Less still at no load. 0.50V was the 4Ω adjustment.
Max Long Term Output vs Bias
View attachment Max Output vs Bias.pdf
Max Short Term Output at 0.50V Bias
View attachment CEA-2006 MOD.pdf
THD and Group Delay OEM vs MOD
View attachment THD & Group Delay.pdf
SMPTE IMD OEM vs MOD
View attachment SMPTE.pdf
Last edited:
All of the Class B amps are like that, measure across the driver's emitter resistors as the output xsistors are off and no voltage/current across their emitter resistors. Phase Linear, BGW, and DC300 are just a few. If you look at the output of a distortion analyzer with the scope in vector mode (X-Y) you'll still see the crossover spikes when properly aligned. Nature of the beasts with with relatively small heatsinks.
Craig
Craig
Actually the thing most responsible for differing power measurements is line voltage. Any legit power measurement has to be done while riding a big Variac, or with some automatic system. You also have to measure the line voltage right at the plug.
I use a big 20A Variac that hauled back from Japan in the late '80s. I have a DMM attached right to the output and it works great. Couldn't do without it.
Craig
Craig
Actually the thing most responsible for differing power measurements is line voltage. Any legit power measurement has to be done while riding a big Variac, or with some automatic system. You also have to measure the line voltage right at the plug.
I can do that - thanks. More stuff that I didn't know, but it certainly makes sense with these old school linear power supplies. I'll measure at 115V, 120V and 125V and report back.
Listening and Conclusions
Turns out I lied. I'm not going to bother getting my big Variac from the shop, but...
I did spend some time listening to the amp through a pair of Danley SM100 8" coax loudspeakers that I use for this kind of thing. They are one of Tom Danley's first designs along with the SH50 and still one of the best, if not the best sounding loudspeaker they make. It doesn't go under about 90Hz, but that is my preference for subjective amp testing as it makes it much easier to focus on what really matters. IMO. 🙂
The reference amp I use for comparison is a Mark Levinson No 523H. It is the best sounding amp of any topology I've ever heard. I have a pair of Martin Logan Summit X electrostatics that are my normal listening setup, but these loudspeakers go slightly under 1Ω at 20kHz and that capacitive load makes for a poor amp comparison loudspeaker. Thus the Danley's.
I only listened to the DC-300A II with the high 0.50V bias that removes the visible crossover distortion per my earlier posts in this thread. In that configuration, the amp exhibited absolutely NO evidence of the broken glass syndrome at high frequencies. The amp was warm and smooth, almost to a fault. It reminded me of my Macintosh MC275's, which is both a compliment and an insult. The former I just covered, but on the latter the smooth/warmth thing also has a way of softening and occluding the "space" and "air" in very well recorded female vocals (Holly Cole for example), and instruments with mid-high and high content (Jazz percussion, grand piano) were a bit darker and constricted in space compared to the reference amp.
Bottom line: I could easily listen to this amp for the rest of my life. It is excellent, just not as good as the current state of the art. What did I do? I re-biased it to OEM specs, got that glorious crossover distortion back as seen in an early post and will probably never listed to the DC-300A II again. I bought this thing for three reasons; for laboratory measurements that require both AC and DC output, to learn about solid state amp restoration, and finally because this was the amp model that was in the church where I first ran live sound back in the mid 80's. It drove a pair of Bose 802's and used a Tapco mixer with rotary knobs instead of linear faders. Pretty dreadful. 🙂
Now... The reason I decided to skip the Variac for trying to diagnose the maximum output variations I've seen as I've restored this amp is because when I re-biased to the top end of the OEM spec, I got close to the OEM power back. Thus I'm convinced that biasing was the primary independent variable responsible for the dependent variable of power. The amp also got very cool to the touch again and as a result will probably stay in spec longer than I will. A definite keeper.
Here are the new max output measurements:
View attachment Max Output vs Bias 2.pdf
PS: Will someone PLEASE tell me how to attach a PDF to a post in such a way that doesn't force you to download it? I would much prefer it simply open in a new tab in your browser that you could download afterwards if you were so inclined. Thanks!
Last edited:
- Home
- Amplifiers
- Solid State
- Crown DC-300A II Restore with Measurements