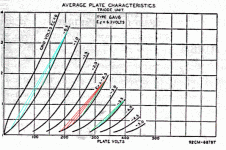
When you go into the Radiotron or other handbook, you are given values of gm, rp etc. which are based upon the linear portion of the curve.
For transconductance, dI(p)/dV(g), would it not be more appropriate to average all the slopes, including the non-linear portions.
I have in my mind something like the "contrast index" for film in which the CI is calculated with a toe and head region -- of course RCA, Sylvania, Tugnsram and Mullard were doing this well before computers which integrate large numbers of values very quickly.
Thoughts anyone???
ps -- maybe an exponential would be even more helpful -- and you could use the data to fill in the blanks when using the Koren Spice equations.
The reason I ask is that I am finished Visual Basic programming of the form and mechanics for the Tube Tracer and have begun to wonder what data people would consider helpful for their analysis.
Can't remember where I read it but apparently at one point designers modelled a tube's plate curves as a three-dimensional surface in clay. I'm guessing it was a simple matter of placing a straight edge across the model to find a linear operating region. Would something like this, and perhaps an additonal three-dimensional representation of the slope of this surface (don't know with respect to which variables though) be a valuable tool as well?
Maybe I do not understand exactly what you are trying to do, but I see no point in deriving an average value for gm or mu or rp. The fact that these parameters vary with the operating point is an important part of the reality of a tube. Using some sort of average value would just be false. The tube manuals are giving a value at a specific point, and state what that point is. They also will give the values at more than one point, and give graphs o gm, mu and rp versus plate current. Variations in gm and mu with bias point is used in radio AVC circuits, and are what set the amplitude of the output of an oscillator. Tubes with just one average value of mu, gm or rp would not work in these types of circuit. There are probably other examples.
As for what data would be useful from a Tube Tracer, basically what I would want is the raw data in spread sheet form. In other words the very same data you would collect if doing the job manually : plate current, screen current, and grid current (if applicable) versus plate, screen and grid voltage. I can then import the data into Excel, or Mathcad or whatever, and do whatever math I want with the data, extract SPICE model parameters, graph it, plot load lines, or whatever. Or have you Tube Tracer do the same math on the data itself and output a Spice model with out the user ever seeing the raw data.
I personally would want the raw data.
- Status
- Not open for further replies.
