I do not know how to calculate the theoretical phase response of a loudspeaker, and it's driving me nuts.
For example, I know that the amplitude response for a closed-box loudspeaker is given by the transfer function,
H(s) = s^2/(s^2 + s/Qtc +1)
Okay, I calculate Qtc and fc for the driver/box combination, and then for a range of frequencies x, I plug i*x/fc into the formula.
Amplitude = modulus( H(i*x/fc) )
Phase_response = degrees(phase( H(i*x/fc) ))
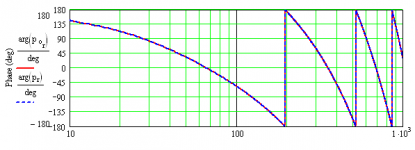
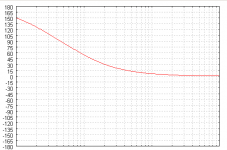
The amplitude chart comes out perfectly. But the phase is all wrong. It approaches zero as frequency grows. That's not surprising when one considers that H is also the transfer function for a second order high-pass filter. But phase charts for loudspeakers do not look like that. Below is a phase chart from MJK's Mathcad program, and the one that I get. Way different.
What's the trick? Martin?
For example, I know that the amplitude response for a closed-box loudspeaker is given by the transfer function,
H(s) = s^2/(s^2 + s/Qtc +1)
Okay, I calculate Qtc and fc for the driver/box combination, and then for a range of frequencies x, I plug i*x/fc into the formula.
Amplitude = modulus( H(i*x/fc) )
Phase_response = degrees(phase( H(i*x/fc) ))
The amplitude chart comes out perfectly. But the phase is all wrong. It approaches zero as frequency grows. That's not surprising when one considers that H is also the transfer function for a second order high-pass filter. But phase charts for loudspeakers do not look like that. Below is a phase chart from MJK's Mathcad program, and the one that I get. Way different.
What's the trick? Martin?
Attachments
Last edited:
- Status
- Not open for further replies.