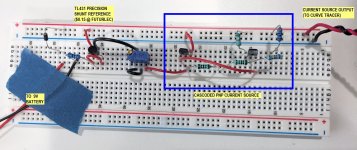
I built this little guy on a solderless protoboard an hour ago. I didn't have any 400 ohm resistors so I kludged together a 330R in series with a 68R. I also didn't have any 300 ohm resistors so I put two 150Rs in series. And to get "R6 = 524 ohms" I just plopped down a trimmer pot.
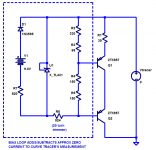
In real life where you've got three actual terminals (Pos_Supply, Neg_Supply, CCS_out) it's pretty straightforward to set up the biasing. But in a curve tracer environment where you only have TWO terminals (DeviceUnderTest_pos , DeviceUnderTest_neg), rude contrivances and grubby stunts are called for. In this case, an external 9V battery to pump several milliamps through the TL431 without affecting the current measured by the curve tracer. {In real life just eliminate the battery and D1, ground R7, and change R7's resistance to something more suitable}
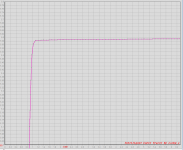
The "knee" of the curve is at about 1.1 volts; the CCS is nice and constant for voltages greater than 1.09V . And the constant current is nice and flat, meaning high output impedance. Best of all, you can (SHOULD) deploy BFCs to keep both base voltages constant and rock steady even at high frequency, improving CCS behavior at frequencies above DC.
In the curve tracer output plots, the horizontal axis is voltage (across the CCS) and the vertical axis is current (through the CCS), plotted in mA.
_
In real life where you've got three actual terminals (Pos_Supply, Neg_Supply, CCS_out) it's pretty straightforward to set up the biasing. But in a curve tracer environment where you only have TWO terminals (DeviceUnderTest_pos , DeviceUnderTest_neg), rude contrivances and grubby stunts are called for. In this case, an external 9V battery to pump several milliamps through the TL431 without affecting the current measured by the curve tracer. {In real life just eliminate the battery and D1, ground R7, and change R7's resistance to something more suitable}
The "knee" of the curve is at about 1.1 volts; the CCS is nice and constant for voltages greater than 1.09V . And the constant current is nice and flat, meaning high output impedance. Best of all, you can (SHOULD) deploy BFCs to keep both base voltages constant and rock steady even at high frequency, improving CCS behavior at frequencies above DC.
In the curve tracer output plots, the horizontal axis is voltage (across the CCS) and the vertical axis is current (through the CCS), plotted in mA.
_