"Referring now to FIG. 8, there is shown a cutaway perspective view of an exemplary electroacoustical Waveguide system according to the invention. The waveguide system of FIG. 8 uses the implementation of FIG. 6, With the FIG. 8 implementation of the elements of FIG. 6 using common identifiers. In the implementation of FIG. 8, Waveguide 11 has a substantially uniform cross sectional area of 12.9 square inches and a length of 25.38 inches. The acoustic volumes 24a and 24b have a volume of 447 cubic inches and 441 cubic inches, respectively, and the acoustic drivers are 5.25 inch 3.8 ohm drivers available commercially from Bose Corporation of Framingham."
Using this information, I think it's possible to put together a Hornresp sim that will approximate the response of the Bose LSPS bass module up to the frequency at which the distance between the two entry points of the driver chambers into the path approaches 1/4 wavelength. At longer wavelengths, the separate driver chambers can be modeled as one chamber container located at the midpoint between the two entry points.
From the description and diagram, the entry points are separated by 32.34 cm, so from that we have:
So, at frequencies below 264 Hz, we should be able to model the separate driver chambers as one chamber container located at the midpoint between the two entry points and get good results. Other information in the patent suggests that this entry point should be 0.25*L, where L is the length of the TL's path, so we end up with the following:
Vtc = 447+441 = 88 cu.in. = 14.6 L
S1 = S2 = S3 = 12.9 sq.in = 83.23 cm^2
L = 25.38 in = 64.47 cm
0.25*L = 16.12 cm
L12 = 16.12 cm, L23 = 64.47-16.12 = 48.35 cm
As for Atc, required to complete the model, I estimated from the diagram that it's about 2*S1 = 166.4 cm^2
From those parameters, we get this:

Which in turn predicts this:

However, this model is incomplete, because it doesn't include the impact of the stuffing in the driver chambers.
To do that, we can convert the model into a stubbed horn, treating S1-S2 as the "stub" and the driver chambers as part of path with a discrete change between the new S1-S2 and S2-S3 segments. With David's help with the model, we now end up with this:
L12 = 14551.7/166.46 = 87.42 cm
Path
S1 = S2 = 166.46 cm^2
S2S = S3 = 83.23 cm^2
L23 = 48.35 cm
Stub
S5=S6 = 83.23 cm^2
L56 = 16.12 cm
With that info, we end up with this:

As for stuffing, I cheated a bit and adjusted the stuffing in the L12 section until Fb was a close match for the measured Fb of the Bose LSPS subwoofer:

Comparing this against a rough FR test I did last night, the sim'd response looks like a pretty decent match to the measured response from 30 to 200 Hz:

Using this information, I think it's possible to put together a Hornresp sim that will approximate the response of the Bose LSPS bass module up to the frequency at which the distance between the two entry points of the driver chambers into the path approaches 1/4 wavelength. At longer wavelengths, the separate driver chambers can be modeled as one chamber container located at the midpoint between the two entry points.
From the description and diagram, the entry points are separated by 32.34 cm, so from that we have:
| 1/4L | = | cm |
| L | = | cm |
| c | = | m/s |
| F | = | Hz |
[td width="64px"]
32.24
[/td][td]
128.96
[/td][td]
340
[/td][td]
264
[/td]So, at frequencies below 264 Hz, we should be able to model the separate driver chambers as one chamber container located at the midpoint between the two entry points and get good results. Other information in the patent suggests that this entry point should be 0.25*L, where L is the length of the TL's path, so we end up with the following:
Vtc = 447+441 = 88 cu.in. = 14.6 L
S1 = S2 = S3 = 12.9 sq.in = 83.23 cm^2
L = 25.38 in = 64.47 cm
0.25*L = 16.12 cm
L12 = 16.12 cm, L23 = 64.47-16.12 = 48.35 cm
As for Atc, required to complete the model, I estimated from the diagram that it's about 2*S1 = 166.4 cm^2
From those parameters, we get this:
Which in turn predicts this:
However, this model is incomplete, because it doesn't include the impact of the stuffing in the driver chambers.
To do that, we can convert the model into a stubbed horn, treating S1-S2 as the "stub" and the driver chambers as part of path with a discrete change between the new S1-S2 and S2-S3 segments. With David's help with the model, we now end up with this:
L12 = 14551.7/166.46 = 87.42 cm
Path
S1 = S2 = 166.46 cm^2
S2S = S3 = 83.23 cm^2
L23 = 48.35 cm
Stub
S5=S6 = 83.23 cm^2
L56 = 16.12 cm
With that info, we end up with this:
As for stuffing, I cheated a bit and adjusted the stuffing in the L12 section until Fb was a close match for the measured Fb of the Bose LSPS subwoofer:
Comparing this against a rough FR test I did last night, the sim'd response looks like a pretty decent match to the measured response from 30 to 200 Hz:

I'd think it has more to do with the bass module having to reach up to ~200 Hz where the "Jewel Cube" speakers used in these systems crap out.There is another question to be answered though - why did Bose elect to use drivers with such high Fs (~74 Hz) and high Qts (~0.7) in a bass module that's tuned to around 43 Hz? I have a suspicion that it's to improve power handling at frequencies below Fb...
Also, Bose probably had plenty of the 5.25 inch mid-bass drivers already available..
They could have done that with basically any decent bass driver. The response above 200 Hz or is largely influenced by the type of alignment that they chose anyway and the amplifier includes some EQ.
I'm curious though if these 5.25" drivers were used in any systems prior to the LSPS bass module.
I'm curious though if these 5.25" drivers were used in any systems prior to the LSPS bass module.
Low cost for small magnet and light voice coil+cone?why did Bose elect to use drivers with such high Fs (~74 Hz) and high Qts (~0.7)
In all Acoustimass bass modules, starting from AM5 (6th order bandpass, two 5.25 woofers inside) in year 1987:I'm curious though if these 5.25" drivers were used in any systems prior to the LSPS bass module.
Acoustimass AM3 (6th order bandpass, single 5.25 woofer) from 1994 was very small and cute:
Also in model 501 series V from 1994:
It was also 6th-order bandpass, where single 5.25 woofer was placed horizontally inside, making very elegant slim and tall enclosure. Frequency response vas unusually flat.
Last edited:
The first pair looks like the drivers from the LSPS bass module.
The third one looks like the drivers used in the AM5 8th order BP module
The third one looks like the drivers used in the AM5 8th order BP module
No.Yes, but was it the SAME 5.25" woofer used in all of those models?
BP1Fanatic was faster.
There is another question to be answered though - why did Bose elect to use drivers with such high Fs (~74 Hz) and high Qts (~0.7) in a bass module that's tuned to around 43 Hz? I have a suspicion that it's to improve power handling at frequencies below Fb...
I'm more convinced now that their chose of specs for that driver for that enclosure were for two reasons:
1. To get that rising response from ~40 Hz to 100 Hz.
2. To improve power handling below Fb.
This is what Hornresp predicts for the system being driven with 6.4V (works out to about 32W into the system's DC resistance):
Measured distortion below 100 Hz basically follows this curve, with a dip in THD around 40 Hz, and THD flattening out at 10% below 30 Hz. This also suggests that the driver's usable Xmax is 3mm. The drivers seem to have rather large surrounds for such a limited Xmax.
Ok, some distortion measurements. Note that the THD is a decent match for the driver excursion predicted by Hornresp below 100 Hz. Above 100 Hz though, hmm. I do have a hypothesis though why the distortion above 100 Hz is higher than expected - the glue that Bose used to fasten the plastic internal structure to the chipboard box is failing and the parts are beginning to separate from the box, causing air leaks. Not sure how I'm going to fix that, LOL. Damn Bose, couldn't you not have used a few screws to make sure everything stayed together? OTOH, the DUT is about 20 years old, so...

Good day!
This might be a '6th Order Series-Offset Bass-Reflex' design, where one driver operates in a 4th-order alignment and the other in a 6th-order alignment. This type of configuration is commonly used in home theater applications. Pete Kulick demonstrates this concept in the following video:
This might be a '6th Order Series-Offset Bass-Reflex' design, where one driver operates in a 4th-order alignment and the other in a 6th-order alignment. This type of configuration is commonly used in home theater applications. Pete Kulick demonstrates this concept in the following video:
I managed to put together an Akabak script using the old Akabak, not the new one that describes what Bose is talking about in their patent. In fact, it goes even further as it allows both drivers to be offset along the path of the TL. I will call this creation a "dual-offset driver TL" 🙂. Basically it involves the use of two drivers, with the center point between the drivers chosen to eliminate the effect of the first harmonic resonance, and the distance between the two drivers chosen to eliminate the first peak and dip that shows up after the first harmonic resonance.
I think diagrams will better explain what's going on.
The diagram below shows the predicted output for a typical two-driver ODTL with the drivers placed close together at the best location down the path to eliminate the null that would be caused by the 1st harmonic resonance at 200 Hz, which for this TL works out to be L/2.874, where L is the path length of the TL. The null is eliminated, but now there's another deep null around 400 Hz with two significant peaks in the response above and below it. There are also several significant dips and peaks above 400 Hz. This is good enough for subwoofer duty, but what if you wanted to use the TL a little bit higher in frequency ...?

The diagram below shows the predicted output for a same two-driver ODTL, this time with the drivers separated by a distance that works out to L/4.874 for this particular TL, where L is the total length of the TL, and the center point between the drivers at the best location down the path to eliminate the null that would be caused by the 1st harmonic resonance at 200 Hz. Both the 200 Hz AND 400 Hz nulls are now eliminated, as well as the peak that was between them, with minor impact on the passband up to 200 Hz.

Note that none of these sims include the impact of box losses or lining or stuffing the line, which will significantly reduce the predicted peaks and dips at higher frequencies as predicted by the sim.
Worked Example:
L = 125 cm (TL path length)
O1 = 2.874 (offset of center point between the two drivers along L)
O2 = 4.874 (offset of the drivers from the center point on L)
L1 = L/O1 = 125/2.874 = 43.5 cm
L2 = L/O2 = 125/4.874 = 25.6 cm
L12 = L1-L2 = 43.5 - 25.6 = 17.9 cm (location of driver #1)
L23 = 2*L2 = 51.2 cm
L34 = L - (L12 + L23) = 125 - (17.9 + 51.2) = 55.9 cm
So, a dual-offset driver TL that's 125 cm long with O1=2.874 and O2=4.874 will have driver #1 located 17.9 cm down the line and driver #2 located 51.2 cm down the line from driver #1.
I suspect that converting that sim into an actual build might be um, challenging. but the result should be a lot less lining or stuffing required to deal with the out of band dips and peaks, and a usable response that extends a bit higher than a simple offset driver TL.
I've attached the script, just in case anyone wants to have a play with it. Perhaps someone more experienced with Akabak than I am (I literally have only a few hours of experience) can check it for errors.
Questions:
1. Does anyone know how to include the effect of box losses in the old version of Akabak?
2. Is it possible to import a script from the old version of Akabak into the new version of Akabak?
I think diagrams will better explain what's going on.
The diagram below shows the predicted output for a typical two-driver ODTL with the drivers placed close together at the best location down the path to eliminate the null that would be caused by the 1st harmonic resonance at 200 Hz, which for this TL works out to be L/2.874, where L is the path length of the TL. The null is eliminated, but now there's another deep null around 400 Hz with two significant peaks in the response above and below it. There are also several significant dips and peaks above 400 Hz. This is good enough for subwoofer duty, but what if you wanted to use the TL a little bit higher in frequency ...?
The diagram below shows the predicted output for a same two-driver ODTL, this time with the drivers separated by a distance that works out to L/4.874 for this particular TL, where L is the total length of the TL, and the center point between the drivers at the best location down the path to eliminate the null that would be caused by the 1st harmonic resonance at 200 Hz. Both the 200 Hz AND 400 Hz nulls are now eliminated, as well as the peak that was between them, with minor impact on the passband up to 200 Hz.
Note that none of these sims include the impact of box losses or lining or stuffing the line, which will significantly reduce the predicted peaks and dips at higher frequencies as predicted by the sim.
Worked Example:
L = 125 cm (TL path length)
O1 = 2.874 (offset of center point between the two drivers along L)
O2 = 4.874 (offset of the drivers from the center point on L)
L1 = L/O1 = 125/2.874 = 43.5 cm
L2 = L/O2 = 125/4.874 = 25.6 cm
L12 = L1-L2 = 43.5 - 25.6 = 17.9 cm (location of driver #1)
L23 = 2*L2 = 51.2 cm
L34 = L - (L12 + L23) = 125 - (17.9 + 51.2) = 55.9 cm
So, a dual-offset driver TL that's 125 cm long with O1=2.874 and O2=4.874 will have driver #1 located 17.9 cm down the line and driver #2 located 51.2 cm down the line from driver #1.
I suspect that converting that sim into an actual build might be um, challenging. but the result should be a lot less lining or stuffing required to deal with the out of band dips and peaks, and a usable response that extends a bit higher than a simple offset driver TL.
I've attached the script, just in case anyone wants to have a play with it. Perhaps someone more experienced with Akabak than I am (I literally have only a few hours of experience) can check it for errors.
Questions:
1. Does anyone know how to include the effect of box losses in the old version of Akabak?
2. Is it possible to import a script from the old version of Akabak into the new version of Akabak?
Attachments
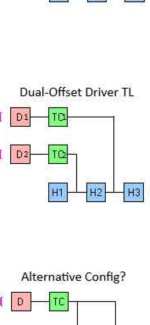
This is what it looks like, using Hornresp's "System Model" terminology. Note: Hornresp actually cannot sim this type of system, but if it could, this is how it probably could be done. Note the "alternative config" probably won't be entirely accurate.

Lots of different enclosure designs...but, for some unknown reason, not even one single measurement was supplied. Quite disappointing overall.This might be a '6th Order Series-Offset Bass-Reflex' design, where one driver operates in a 4th-order alignment and the other in a 6th-order alignment. This type of configuration is commonly used in home theater applications. Pete Kulick demonstrates this concept in the following video:
That looks like "Hexibase"'s stuff. Some of his work looks pretty good. Some of it is, well, "questionable".
I guess this is the ‘same’ ? (Vent end is at my hand, far end is capped/closed) I just need to fine tune it to the 1/5 and 1/3 nodes?
Attachments

Last edited:
Yup. It does look like it.
Conceptualizing something like this being folding into a rectangular shape is proving to be quite the challenge, especially I want the drivers to end up being physically close together, to ensure the build's measured FR is a close match to the predicted FR.
I still need to figure out how to add the effect of box losses / stuffing / lining to the Akabak sim. Without those, the sim of the Bose LSPS bass module in Akabak produces an FR that's not a good match for the measured FR of that system.
- Home
- Loudspeakers
- Subwoofers
- Bose LSPS Subwoofer Model (v1)