This graph is cleared using a filter of 20 dB. So you have to add to the level of the first harmonic of the 20 dB. After that, the level of the second harmonic it is necessary to add about 10 dB, and the level of third harmonic to add about 6 dB because the filter was suppressed and their frequencies.
Therefore, the level of the second harmonic is approximately -110 dB, and the third is almost the same.
Therefore, the level of the second harmonic is approximately -110 dB, and the third is almost the same.
Yes. This filter suppresses the first harmonic.
There are also filters for the generator. These filters pass a first harmonic, suppressing the rest. So we can improve the parameters of the generator.
There are also filters for the generator. These filters pass a first harmonic, suppressing the rest. So we can improve the parameters of the generator.
Last edited:
Do it properly. The easy way is to build the R.Cordell distortion magnifier.
The paper describes both a 20dB and 40dB adjustment for the magnifier.
There are similar mentioned occasionally in this Forum.
The paper describes both a 20dB and 40dB adjustment for the magnifier.
There are similar mentioned occasionally in this Forum.
Article on the 2T feedback Current Source
Regarding the 2T feedback current source and its stability, Michael Kiwanuka has been kind enough to forward to me an article that he has written on that current source, which he refers to as an Amplified Negative Feedback current source (ANF). In it, he includes a discussion of stability. I have read the article and I believe it is excellent. With his permission, I have posted it below.
Cheers,
Bob
Attachments
Bob, that PDF is one page long. Two figures and no text. Did parts of the article disappear?
Hi Mark,
The file is 14 pages long, and I just realized that it is over the forum's approximate 1MB limit by a tad.
I'll try to ZIP it and re-post.
Sorry,
Bob
Is Michael going to allow you to post the entire article?Regarding the 2T feedback current source and its stability, Michael Kiwanuka has been kind enough to forward to me an article that he has written on that current source, which he refers to as an Amplified Negative Feedback current source (ANF). In it, he includes a discussion of stability. I have read the article and I believe it is excellent.
_________________
Actually this brings up a good question for Mark Johnson & Bob.
Would wriggles in the output Z on a plot to 100MHz be a reliable indication of stability problems with the 2T CCS?
I ask as I'm having problems interpreting my poor attempts at simming the instability that Mark found. 😡
I'm hoping, of course, that making the output Z plot look nice means I'm making the CCS stable too 😀
Found this post by Michael Kiwanuka which said,
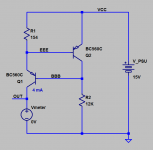
For those who prefer .TRANsient analysis instead of .AC analysis: Inject a current impulse into node EEE and observe the transient behavior. Do it again with 30pF of stray capacitance from EEE to VCC.
He ought to try simulating two BC560's and the Cordell Audio spice models as shown below. Phase margin is NOT in excess of 90 degrees.... simulating the ANF current source's loop gain in SPICE. This should demonstrate that said ANF current source possesses completely innocuous LHP singularities giving a phase margin in excess of 90 degrees.
For those who prefer .TRANsient analysis instead of .AC analysis: Inject a current impulse into node EEE and observe the transient behavior. Do it again with 30pF of stray capacitance from EEE to VCC.
Attachments

Last edited:
Bob, type "shrink pdf" into Google, you'll get a bunch of websites that compress pdf files for free. Maybe that'll get you under the limit. Or if you have the full (not free) version of Acrobat, under the Document tab there's a menu item "extract pages". You can then make a new .pdf of pp.1-3, a second .pdf of pp 4-6, a third .pdf of pp. 7-9 and so on.
So we are talking about this deltas (graph from your post 7759):This graph is cleared using a filter of 20 dB. So you have to add to the level of the first harmonic of the 20 dB. After that, the level of the second harmonic it is necessary to add about 10 dB, and the level of third harmonic to add about 6 dB because the filter was suppressed and their frequencies.
Therefore, the level of the second harmonic is approximately -110 dB, and the third is almost the same.
H2: -112 (10dB delta)
H3: -98 (14dB delta)
H4: -120 (18dB delta?)
=> is about 13 ppm for a given frequency of 16kHz as shown in the graph from post if we completely ignore higher harmonics and noise.
How good is the soundcard above 20kHz? How much signal level is lost due to a built in filter. Have you done a swept analysis of the frequency response of your soundcard?
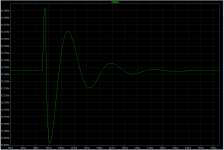
And here it is. We can measure phase margin two different ways.
Perhaps the easiest is to run a .TRANsient analysis, inject a disturbance, and plot the ringing. Then we use the method of Logarithmic Decrements to find the damping factor Zeta. Measuring the first and third "troughs" in the waveform:
The not quite so easy way to measure phase margin in simulation, is to run an .AC analysis. The result is Figure 3; Phase Margin = 27.3 degrees as seen in the little cursor window. The two answers are satisfyingly similar.
At least for this one particular instance of an "Amplified Negative Feedback" current source, using Cordell Audio spice models of BC560 transistors, Phase Margin is dangerously low: waaaaay less than 90 degrees.
Perhaps the easiest is to run a .TRANsient analysis, inject a disturbance, and plot the ringing. Then we use the method of Logarithmic Decrements to find the damping factor Zeta. Measuring the first and third "troughs" in the waveform:
x1=51.5mV
x3=2.5mV
delta=1.513
Zeta=0.234
Now that we know the damping factor Zeta, we can use the handy second order linear systems formula from this web page to convert from Zeta into phase margin in degrees. The answer is: Phase Margin = 26.3 degrees when Zeta=0.234.x3=2.5mV
delta=1.513
Zeta=0.234
The not quite so easy way to measure phase margin in simulation, is to run an .AC analysis. The result is Figure 3; Phase Margin = 27.3 degrees as seen in the little cursor window. The two answers are satisfyingly similar.
At least for this one particular instance of an "Amplified Negative Feedback" current source, using Cordell Audio spice models of BC560 transistors, Phase Margin is dangerously low: waaaaay less than 90 degrees.
Attachments

Bob, type "shrink pdf" into Google, you'll get a bunch of websites that compress pdf files for free. Maybe that'll get you under the limit. Or if you have the full (not free) version of Acrobat, under the Document tab there's a menu item "extract pages". You can then make a new .pdf of pp.1-3, a second .pdf of pp 4-6, a third .pdf of pp. 7-9 and so on.
Bullzip uses the open source Ghostscript to allow these manipulations as well as printing pages to TIFF to extract drawings and figures. It's free, one of the first things that goes onto any new computer.
although this is a lot of work instead of just using a different CCS design 🙂, I'd still like to read mike's paper.
bob, if you email it to me, i'll shrink and upload it.
mlloyd1
bob, if you email it to me, i'll shrink and upload it.
mlloyd1
.....or splitting the pdf the simple way. There are many pdf writers out there in the form of a printer device, such as CutePDF Writer, Foxit Reader PDF Printer, that can send a print to a PDF file. Just install them as a printer to the OS, select one at time of print.
By selecting a range of pages, or certain pages, to print at a time, a big pdf can be split quickly and easily.
This is also a quick and effective way of getting a popular black-ink-over-white-background image from a reversed display color scheme CAD software when posting a drawing to the forum.
By selecting a range of pages, or certain pages, to print at a time, a big pdf can be split quickly and easily.
This is also a quick and effective way of getting a popular black-ink-over-white-background image from a reversed display color scheme CAD software when posting a drawing to the forum.
You can also tell BullzipPDF to 'print' a PDF at 300dpi which quarters the file size
BTW, I got a few more references and papers on instability of seemingly innocent followers:
https://linearaudio.nl/miscellaneous
First entry, courtesy Erik Margan.
Jan
BTW, I got a few more references and papers on instability of seemingly innocent followers:
https://linearaudio.nl/miscellaneous
First entry, courtesy Erik Margan.
Jan
You can also tell BullzipPDF to 'print' a PDF at 300dpi which quarters the file size
Jan
Much of postscript is vector/description based independent of device resolution. That's why you can blow up ExpressPCB schematics and get no pixillation.
Your suggestion might shrink some images especially uncompressed ones.
Right; I stand corrected. In my use it works because I always have illustrations in those files that are not vector based.
Jan
Jan
Because the amplifier feedback above 16 kHz falls at a rate of 40 dB/decade, of distortion will be proportional to grow. Obviously, while understating the level of distortion due to a decline in the frequency response of the sound card. By the same logic, distortion in an audio signal bandwidth to be less than for a frequency of 20 kHz, so we see the worst of the possible values: -110 dB.H4: -120 (18dB delta?)
I repeat: I needed to measure the level of distortion 20K only to check the results of the simulation. So I rely on these measurements for the first two or three harmonics.
We used not very good sound card. I didn't measure distortion, it was done by other man. I designed the circuitry, sent him over the 600 km of the model or the circuit, and he assembled amplifiers and measured parameters. So I don't know some of the details of the measurements.is about 13 ppm for a given frequency of 16kHz as shown in the graph from post if we completely ignore higher harmonics and noise.
How good is the soundcard above 20kHz? How much signal level is lost due to a built in filter. Have you done a swept analysis of the frequency response of your soundcard?
Some measurements not too good. We have just started to learn to measure. We are fans and not experts.
Last edited:
ANF article post
Finally I think I have posted Michael's ANF current source article successfully. I posted the article in 2 pdf pieces. I apologize for the delay and thank all of those who posted suggestions. I am such a computer Geek - NOT!
Cheers,
Bob
Finally I think I have posted Michael's ANF current source article successfully. I posted the article in 2 pdf pieces. I apologize for the delay and thank all of those who posted suggestions. I am such a computer Geek - NOT!
Cheers,
Bob
Attachments
- Home
- Amplifiers
- Solid State
- Bob Cordell's Power amplifier book