hello,
I'm in search of ideas for a LTspiceIV test rig in the context of Benjamin AES paper in 1992, about the I-V Locus issue on Audio Power Amplifiers output stages.
The paper can be found here : AES E-Library: Audio Power Amplifiers for Loudspeaker Loads
See attached picture.
I am thinking about independent random generators making 50% - 200% non correlated independents modulations (with gaussian distribution centered on 100%) of the values of each R L C component arranged to form the equivalent schematic of a multiway loudspeaker, say a 2-way bass-reflex box. Using this, we'll see the amount of THD at 1kHz.
Such 1kHz dynamic load distorsion figure would be easy to read, and easy to publish.
Due to the fact that the modulated values are not correlated with the input signal, one should expect the noise floor of the output signal being raised. That's another indicator : the noise floor. To be appreciated by doing a hi-res FFT on the output signal under LTspiceIV Waveform Viewer.
Such dynamic load noise floor spectrum would be easy to read, and easy to publish.
Then, we may step into something different, like not anymore amplifying a sine, but amplifying a low-pass filtered random signal. But, in the absence of a sine, how to measure the non-linearity ? One cannot use a dumb difference method, as the amplifier has a phase and amplitude response. Due to this, there always will be differences, acceptable differences, between the original signal and the scaled-down amplified signal.
What kind of tool, mathematical tool, is able to ignore linear differences coming from gain and phase (supposed to be static even if we change the load - that's indeed the case of a perfectly linear amp exhibiting a non-straight frequency response), from differences coming from the amplifier phase or gain becoming different, because of the changing load ?
It may be needed to sample the frequency response of the amplifier, on a static 8 ohm resistive load, duplicate it using an analog circuit, and apply this filter to the input signal, when computing the difference between the input signal and the scaled-down signal. How ugly ! I'm sure there are maths doing this natively. Would be nice to get a distorsion spectrum, saying that between 1000 Hz and 1010 Hz, the non-static load distorsion using this test rig is -93 dB referred to the RMS amplitude of the random signal. And so on, for each 10 Hz frequency band, from DC to 50kHz.
Such dynamic load distorsion spectrum would be easy to read, and easy to publish.
Finally, I would like to know if what is exposed here, is already implemented, or can be implemented using a software plugin, inside B&K and/or AP test gear. This time thus, not using simulation, but in the real world.
Any advice welcome.
Cheers,
Steph
Attachments
Last edited:
I think most dudes just throw some back EMF into the output at a
different frequency. Kick back and observe how all goes to Hell in
handbasket.
Because the frequencies are different, you're gonna sweep across
every possible phase angle... Hard to miss a problem if one exists.
If a problem exists, then you gotta ask which amp went nutz first?
Amp under test, or the one generating back EMF?
And what is the recorded signal looks like?
Noise and nonlinearity is not only at the end stage. Microphone and loudspeaker itself has very bad linearity and huge noise creator. Microphone may working as noise and antenna, and loudspeaker may working as big self microphone.
Noise and nonlinearity is not only at the end stage. Microphone and loudspeaker itself has very bad linearity and huge noise creator. Microphone may working as noise and antenna, and loudspeaker may working as big self microphone.
Last edited:
hello,
I'm in search of ideas for a LTspiceIV test rig in the context of Benjamin AES paper in 1992, about the I-V Locus issue on Audio Power Amplifiers output stages.
The paper can be found here : AES E-Library: Audio Power Amplifiers for Loudspeaker Loads
See attached picture.
I am thinking about independent random generators making 50% - 200% non correlated independents modulations (with gaussian distribution centered on 100%) of the values of each R L C component arranged to form the equivalent schematic of a multiway loudspeaker, say a 2-way bass-reflex box. Using this, we'll see the amount of THD at 1kHz.
Such 1kHz dynamic load distorsion figure would be easy to read, and easy to publish.
Due to the fact that the modulated values are not correlated with the input signal, one should expect the noise floor of the output signal being raised. That's another indicator : the noise floor. To be appreciated by doing a hi-res FFT on the output signal under LTspiceIV Waveform Viewer.
Such dynamic load noise floor spectrum would be easy to read, and easy to publish.
Then, we may step into something different, like not anymore amplifying a sine, but amplifying a low-pass filtered random signal. But, in the absence of a sine, how to measure the non-linearity ? One cannot use a dumb difference method, as the amplifier has a phase and amplitude response. Due to this, there always will be differences, acceptable differences, between the original signal and the scaled-down amplified signal.
What kind of tool, mathematical tool, is able to ignore linear differences coming from gain and phase (supposed to be static even if we change the load - that's indeed the case of a perfectly linear amp exhibiting a non-straight frequency response), from differences coming from the amplifier phase or gain becoming different, because of the changing load ?
It may be needed to sample the frequency response of the amplifier, on a static 8 ohm resistive load, duplicate it using an analog circuit, and apply this filter to the input signal, when computing the difference between the input signal and the scaled-down signal. How ugly ! I'm sure there are maths doing this natively. Would be nice to get a distorsion spectrum, saying that between 1000 Hz and 1010 Hz, the non-static load distorsion using this test rig is -93 dB referred to the RMS amplitude of the random signal. And so on, for each 10 Hz frequency band, from DC to 50kHz.
Such dynamic load distorsion spectrum would be easy to read, and easy to publish.
Finally, I would like to know if what is exposed here, is already implemented, or can be implemented using a software plugin, inside B&K and/or AP test gear. This time thus, not using simulation, but in the real world.
Any advice welcome.
Cheers,
Steph
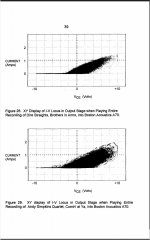
Here is a useful observation when it comes to the degree to which different loads exercise the SOA of the power transistors with sinusoidal excitation. If you know the DCR of the worst-case load you want the amplifier to handle with any phase angle, draw a conventional load line for that resistance on linear corrdinates, from the rail voltage on the X axis to the corresponding current on the Y axis. If the amplifier is 100-W 8 ohms, and it is an ideal amplifier, and the DCR you want to handle is 4 ohms, the line will intersect 40V and 10A.
Now draw a virtual load line whose resistance is twice the DCR from the 10A intersection on the Y axis to the 80V twice Vrail intersection on the X axis. This virtual load line will have a resistance of 8 ohms in this case. All overlapped ellipses of all load combinations with the selected DCR as part of the load will form a line that is the same as the virtual load line you just drew.
The reason that this works is because, for a given DCR in series with the rest of the reactive components of the load, the only way the phase angle can be increased from zero to a larger number is to add reactance in series. This increases the modulous of the impedance. This approach is valid for woofers, which are often the biggest SOA culprits, but can be invalid under some conditions where, for example, a highly capacitive electrostaic driver is connected to the loudspeaker input via a large capacitance in the crossover. Put another way, the approach above assumes that there is a minimum resistance in series with ALL of the reactance of the loudspeaker.
This approach greatly simplifies the estimation of needed SOA for sinusoidal excitation of a load with arbitrary phase angle as long as the applicable DCR is known.
Note that the example above used 4 ohms DCR because it nade the numbers easy. In reality, an honestly rated 4 ohm speaker will have a DCR of about 3.2 ohms. Many will have a DCR of as low as 2.5 ohms. A few will be even worse. So you might end up using 2.5 ohms as the DCR number in the calculations.
You will have some built-in conservatism in your sizing of the output stage if you use the DC SOA of the output devices. Brief excursions outside the DC SOA boundary are OK if the interval is short. For example, look at the 100 ms SOA line for the transistors. Note also that there is some additional margin for reactive load excursions caused by midrange and tweeter circuits because the transient duration of their worst-case excusion is more brief, and only has a 50% duty cycle in a class AB output stage.
You will have even more margin if you use power MOSFETs, which do not suffer from secondary breakdown, so the whole thing is pretty much thermal. Moreover, the SOA boundary for power MOSFETs is usually just the conditions that will raise the junction temperature to, say, the 150C limit. This is a long-term reliability limit, often based on the plastic packaging, and is clearly quite conservative with respect to single-event abuse. Electrically and physically, the power MOSFETs get into a failure mode for transient conditions at significantly higher junction temperatures, on the order of 300C.
Cheers,
Bob
steph,
Are you aware of Peter Baxandall's test for SOA?
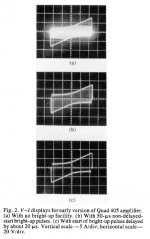
He constructed a load consisting of a capacitor in series with a small resistor like 0.1 ohms.
The test signal consisted of a low frequency sine wave (say 20Hz) with fast, small pulses superimposed on it.
The result was that the lf sine wave exercises the amp for Vce of the output devices (but no load current because of the smallish output cap), while the fast pulses caused very high currents to flow into the 0.1 ohms. In fact, the 0.1 ohms resistor is only there to measure the Iout.
Since the lf wave and the pulses are not synchronised, in a few seconds the whole Vce/Iout space is worked through.
By plotting Vce and Iout on a scope screen he gets similar figures as you showed in your first post, but in all 4 quadrants.
I build this tester and it works although it is difficult to get a good stable picture on a scope. I never got around to convert it to a sample/hold and feed it into a PC.
Anyway, if you are interested, I can mail you the article from Electronics World.
jd
Are you aware of Peter Baxandall's test for SOA?
He constructed a load consisting of a capacitor in series with a small resistor like 0.1 ohms.
The test signal consisted of a low frequency sine wave (say 20Hz) with fast, small pulses superimposed on it.
The result was that the lf sine wave exercises the amp for Vce of the output devices (but no load current because of the smallish output cap), while the fast pulses caused very high currents to flow into the 0.1 ohms. In fact, the 0.1 ohms resistor is only there to measure the Iout.
Since the lf wave and the pulses are not synchronised, in a few seconds the whole Vce/Iout space is worked through.
By plotting Vce and Iout on a scope screen he gets similar figures as you showed in your first post, but in all 4 quadrants.
I build this tester and it works although it is difficult to get a good stable picture on a scope. I never got around to convert it to a sample/hold and feed it into a PC.
Anyway, if you are interested, I can mail you the article from Electronics World.
jd
Attachments
Last edited:
steph,
Are you aware of Peter Baxandall's test for SOA?
He constructed a load consisting of a capacitor in series with a small resistor like 0.1 ohms.
The test signal consisted of a low frequency sine wave (say 20Hz) with fast, small pulses superimposed on it.
The result was that the lf sine wave exercises the amp for Vce of the output devices (but no load current because of the smallish output cap), while the fast pulses caused very high currents to flow into the 0.1 ohms. In fact, the 0.1 ohms resistor is only there to measure the Iout.
Since the lf wave and the pulses are not synchronised, in a few seconds the whole Vce/Iout space is worked through.
By plotting Vce and Iout on a scope screen he gets similar figures as you showed in your first post, but in all 4 quadrants.
I build this tester and it works although it is difficult to get a good stable picture on a scope. I never got around to convert it to a sample/hold and feed it into a PC.
Anyway, if you are interested, I can mail you the article from Electronics World.
jd
Hi Jan,
I was unaware of this Baxandall test; very interesting. I did, however, come up with a proposed test to exercise the SOA regions and protection circuitry of an amplifier that can be somewhat of a torture test.
It is an LF version of the CCIF 19+20 kHz test. The two frequencies are instead 19 Hz and 20 Hz. One of the frequencies is fed forward through the amplifier, while the other one is back-fed into the amplifier from a test amplifier via an 8-ohm load resistor. This test is also somewhat reminiscent of Otala's IIM test, but has different goals. The signal fed forward exercises the output voltage range, while the signal fed backward exercises the current. I have not yet tried it on a real amplifier, however.
Another useful variant of the test is a straight LF CCIF test with both test frequencies fed forward through the amplifier. The 1 Hz beat note varies the output power of the amplifier over a time period that is long enough to bring out some dynamic thermal bias issues in output stages. Obviously, if desired, the beat frequency can be made arbitrarily low. The 1 Hz variation of power can also uncover power supply-related issues in the amplifier. As with standard CCIF, interesting relevant spectral lines will appear at 21, 22, 23 Hz etc as well as the frequencies 18, 17, 16 Hz, etc. Also, even-order distortion will be apparent at 39 Hz.
Cheers,
Bob
- Status
- Not open for further replies.