Two questions.
1) In the "typical" web page calc. The impedance peak at crossover was over 40 Ohms. It seems high. Is it in fact typical?
2) I gather the biggest issue with phase is cancellation. Is that right? If so, I imagine that it can be compensated by eq. Yes?
1) In the "typical" web page calc. The impedance peak at crossover was over 40 Ohms. It seems high. Is it in fact typical?
2) I gather the biggest issue with phase is cancellation. Is that right? If so, I imagine that it can be compensated by eq. Yes?
1. Did you take note of where the combined response was?
2. That would be the first thing to keep in mind. There is a diffrerence between manipulating the response with the phase relationship, and EQing.
2. That would be the first thing to keep in mind. There is a diffrerence between manipulating the response with the phase relationship, and EQing.
1. Well, I think you're talking about 750Hz.
At that point, your sim has a peak of 30Ω and down about 5 dB, the one I posted is down about 3dB and Z peak at 40Ω.
I apologize if I'm not getting your point and you're talking about something else.
2. Thanks
At that point, your sim has a peak of 30Ω and down about 5 dB, the one I posted is down about 3dB and Z peak at 40Ω.
I apologize if I'm not getting your point and you're talking about something else.
2. Thanks
My attachment shows less than 3dB.
There are two basic ways to find that at a crossover frequency.. either use the corresponding filter Q factor to make it happen, or use another Q factor but change the separation between the filter frequencies.
There are two basic ways to find that at a crossover frequency.. either use the corresponding filter Q factor to make it happen, or use another Q factor but change the separation between the filter frequencies.
OK, I think I've digested what you've said so far. Now I'm not sure how much more to ask. I'm kind of expecting you to say go look it up, but from my side I learn better if I'm able to ask simple questions and deal with one piece of the puzzle at a time.
So. . . if you don't mind . . . .
"There are two basic ways to find that at a crossover frequency". What is the "that" you are referring to?
So. . . if you don't mind . . . .
"There are two basic ways to find that at a crossover frequency". What is the "that" you are referring to?
I don't mind. The 'that' is the amount that they add up to right at the crossover frequency.
Two reasons I said that. One is that since the example you mentioned was lower than 0dB, you would expect a higher impedance, and it would also be an unrealistic situation so if you want to see something more normal, first make sure the responses add to between 0dB and +3dB.
Secondly, when you pull this apart, and say compare different filters that add exactly to 0dB, you'll find two possible reasons they might be different. The filter damping is one, and the frequency separation is another.
"One is that since the example you mentioned was lower than 0dB . . . ."
This is of course after reversing the polarity of one driver.(?)
"The filter damping is one, and the frequency separation is another."
By frequency separation you are again referring to the distance between the knees. (?)
(I have to leave the filter damping 'til later. My guess is it's a field of study in itself.)
If phase is that far out, then you'll get minimal output but the drivers will still be working hard. Reversing polarity is necessary to keep the phase relationship.This is of course after reversing the polarity of one driver.(?)
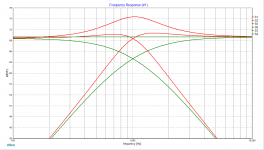
Look at the first picture, it shows high pass, low pass and sum, where green is one damping level and red is another. All filters are at 1kHz.By frequency separation you are again referring to the distance between the knees. (?)
(I have to leave the filter damping 'til later. My guess is it's a field of study in itself.)
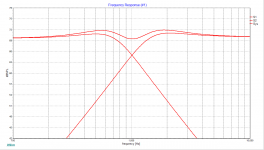
The second picture shows the same (red from the other picture) high Q filters where the frequencies have been pulled apart to try and make them fit. It only partly helps.
Attachments
I had to digest that for a bit but think I got it.
Speaking of Q brings a question about the graph from post #7 . The circled character is new to me. I thought it looked a little like the left two thirds of a Q. Is that what it represents?
Another thing: Is the driver in Xsim a pure resistance? I looked for a driver settings window but didn't find one. The thought was to modify Le, Re, etc. or switch them off , making a resistor so I can see what the crossover itself is doing. (I tried with resistors but there's no sim result without a driver. )
Attachments
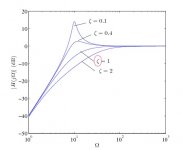
The variable is zeta. It represents damping. It is the inverse of Q.
Xsim makes its drivers look like resistors until you add real driver information. It makes it easy to run tests like this.
Xsim makes its drivers look like resistors until you add real driver information. It makes it easy to run tests like this.


The second image makes it more clear. If you use the Q calculator, you get a F0; this is NOT -3 dB unless it has a Q of exactly 0.707 (BW2). F0 for LR2 is - 6dB, BE2 is -5 dB and so on. The slope starts to look like 12 dB per octave but not right near F0; look out a few octaves then it does become 12 dB.
The variable is zeta. It represents damping. It is the inverse of Q.
Xsim makes its drivers look like resistors until you add real driver information. It makes it easy to run tests like this.
OK, I see. Thanks. Still taking it all in. I'll be back. Thanks again.
- Home
- Loudspeakers
- Multi-Way
- Atypical Web-Crossover Calcuator - Slope vs. Order