Looking to do some simple guestimates for Butterworth crossovers I found this one that unlike other web-page based calculators has an extra option for slope independent of order.
Also, the values differ for low and high pass unlike the others that use the same component values and just exchange position in the circuit for LP/HP.
It makes sense to me that adjusting values will change the slope but how does that fit with the definition of a Butterworth filter and also (more importantly) what is the price to be paid for getting a steeper slope from a lower order filter?
Thanks
Last edited:
I'm sorry, but my knowledge is so limited your answer looks to me either like the first or the last half of a longer sentence.
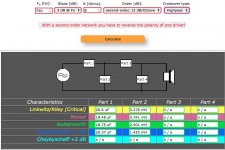
I guess I need to say that every explanation I have seen online says crossovers change at 6dB per octave per order. In the case of the attached images, I don't understand what option is being exercised by changing the slope yet still calling it a second order Butterworth.
The calculator toggles 3dB/6dB @FX for all four orders of filter including first order.
Attachments

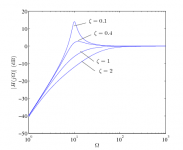
I believe it represents the peak at the crossover frequency.
At 6 dB You have a deeper notch.
Crossovers: Basics
At 6 dB You have a deeper notch.
Crossovers: Basics
Interesting! Learn something new every day. I was taught that -3 dB/XO was for odd orders and -6 dB/XO for even orders only.
Correct.
FWIW, the tutorial is a bit too narrow minded in that the human voice XO points work fine when an appropriate 'full-range' driver is used in the 300 - 3 kHz decade. 😉
FWIW, the tutorial is a bit too narrow minded in that the human voice XO points work fine when an appropriate 'full-range' driver is used in the 300 - 3 kHz decade. 😉
Interesting! Learn something new every day. I was taught that -3 dB/XO was for odd orders and -6 dB/XO for even orders only.
For example that a third order filter would be down by 9dB/octave?
The slope doesn't change, it is 12dB/oct for second order. I think the page is trying to keep them separate by shifting frequencies to make it look better, but this could be misleading. Here is another example that shows the difference is around resonance.
So do you mean that for either 3 or 6dB option on the calculator the angle of the slopes as they would appear on a graph remains the same but the distance between the knees is what is being changed?
It sure is an enigma. It almost seems as though it's offering varying knees and slopes, chosen by the frequency at which they are at -3dB or -6dB, rather than at their resonance.. and then calling it slope.I believe it represents the peak at the crossover frequency.
If I were to use this I'd want to verify what it's doing through simulations... which kind of defeats the purpose.
I'm going to say maybe at this point. (I wrote the above response while you were posting.) There was a time when I would arrange slopes this way and overlap them.So do you mean that for either 3 or 6dB option on the calculator the angle of the slopes as they would appear on a graph remains the same but the distance between the knees is what is being changed?
Do you simulate at all, most simulators will start you with a default driver that looks like a resistor which makes it fairly straightforward for comparing online calculator results.
Not up to speed with simulations , it's usually clip leading and testing. I'd have done the same here but am usually focused on amps so don't have the parts on hand.
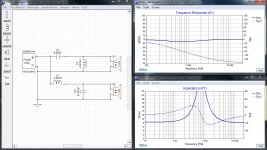
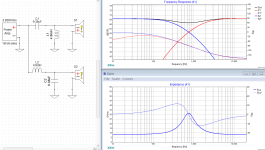
However, your question was enough to get me to try. Done with resistors it gave a flat line right to 10Hz even with the LF driver disconnected. With 8Ω drivers (HF polarity inverted) it shows impedance and phase differences and FR but the FR plot doesn't show slopes.
FR for the mh-audio plot does look better though.
Attachments
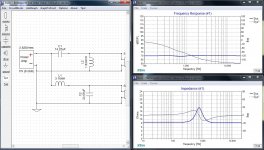
This is an excellent outcome. Xsim can show separate slopes, using the curves and slopes menu items above the plot area.
You could have found the same using real tests and measurements. To be frank, by the time you discover whether you do or don't trust this online calculator you could have tossed around a few values in the sim. It's all down to choice, but it is easier to be sure just what you're getting.
You could have found the same using real tests and measurements. To be frank, by the time you discover whether you do or don't trust this online calculator you could have tossed around a few values in the sim. It's all down to choice, but it is easier to be sure just what you're getting.
Attachments
For example that a third order filter would be down by 9dB/octave?
It's 6 dB slope/90 deg, so 3rd = 270 deg = 18 dB/octave slope.
This is an excellent outcome.
Just to be sure I understand you. You're not saying the equal value plot is better than the mh-audio plot are you?
Thanks for help on the Xsim.
No, I was alluding to your skill with a simulator and therefore your independence from simple calculators. Not that they can't still give you a starting point. 🙂
If you want to talk about which response is better and why, we can do that too.
If you want to talk about which response is better and why, we can do that too.
Interesting! Learn something new every day. I was taught that -3 dB/XO was for odd orders and -6 dB/XO for even orders only.
It's 6 dB slope/90 deg, so 3rd = 270 deg = 18 dB/octave slope.
I'm sorry GM. You are so far ahead of me I need to check with you on the link between your answers. The second quote above makes sense to me in terms of the usual way of describing crossover orders but the top one is unclear. Is it referring (graphically) to how far down the point is where the two slopes cross? Or in other words, how far apart the HP and LP curve knees are?
No, I was alluding to your skill with a simulator and therefore your independence from simple calculators. Not that they can't still give you a starting point. 🙂
If you want to talk about which response is better and why, we can do that too.
Well, Dang! Talk about encouragement! 🙂
Of course I'd like to know more about which is better, though my own first guess would be that the flatter FR line and smaller impedance peak would make the mh-audio version the better one. The impedance peak on the standard equal part value xo was about 40Ω. Phase is another matter altogether. I don't know what really matters there, though I've read that equal phase at transition is critical. (and it makes sense that it could be.)
The impedance tends to rise through many examples of normal crossovers. Crossing two drivers combines the power of each, and twice power is +3dB. However you can get a bonus 3dB when you measure SPL. The difference is seen in the electrical impedance.
- Home
- Loudspeakers
- Multi-Way
- Atypical Web-Crossover Calcuator - Slope vs. Order