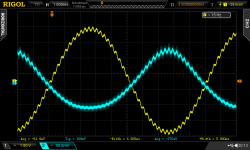
Alright, phase 2 is on, I'm gonna use this setup for what it was actually meant to do, which is output stage and crossover investigations. The test board carrying the transistor under test has been replaced by a board carrying a full output stage.
Yellow is output voltage (sum of two sines) and blue is the base current of one of the transistors. Ib, Vbe, Ie for both transistors are measured, along with output voltage, among other things. I will plug this into the soundcard tomorrow.
Yellow is output voltage (sum of two sines) and blue is the base current of one of the transistors. Ib, Vbe, Ie for both transistors are measured, along with output voltage, among other things. I will plug this into the soundcard tomorrow.
Attachments
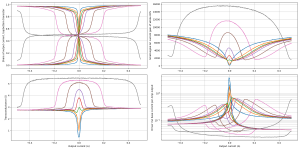
Enlightening: it shows that there are no good universal solutions for a classical OP stage (and maybe no good solutions at all!).
The Xover artefacts in transconductance can be reasonably well minimized, but there is no real optimum with the current gain. This means that current-drive, seen by some as a kind of golden standard is in fact a spelter one
The Xover artefacts in transconductance can be reasonably well minimized, but there is no real optimum with the current gain. This means that current-drive, seen by some as a kind of golden standard is in fact a spelter one
Enlightening: it shows that there are no good universal solutions for a classical OP stage (and maybe no good solutions at all!).
The Xover artefacts in transconductance can be reasonably well minimized, but there is no real optimum with the current gain. This means that current-drive, seen by some as a kind of golden standard is in fact a spelter one
If the amp uses standard Miller compensation, then it spends some of its open loop gain budget in lowering the output impedance of the VAS driving the output stage, so the output stage will be more voltage driven. If it uses a more modern form of compensation, like TMC/TPC, which spends the open loop gain budget on lowering distortion instead, then the output stage will be more current driven. So it is important to avoid huge variations in current gain versus output current...
I've tested the CFP first for practical reasons: I knew it would lose, so let's get it out of the way. Besides, CFP has undesirable current dependent phase shift: when the power transistor turns off it loses a pole.
I think the standard follower output stage will deliver much better results, but I have no idea what the winner will be between BJT, VDMOS, and laterals.
@peufeu: maybe this is useful for your investigations.
I remember this article, the Linear audio volume is on my shelf 😀
If the schedule allows it, I will try to replicate it using different means. But it is not a priority, I trust your results.
I forgot to post the results!
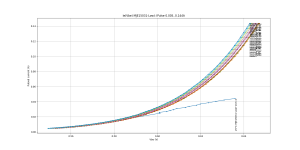
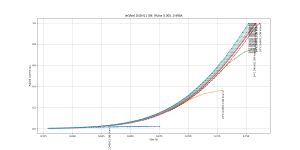
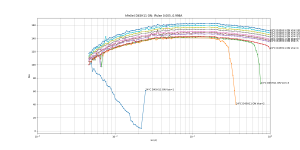
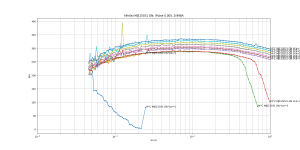
Ie-Vbe at various Ics of PNPs:
2N3906
2SA2039
D45H11
MJE15031
MJL1302
Ie-Vbe at various Ics of PNPs:
2N3906
2SA2039
D45H11
MJE15031
MJL1302
Attachments
-
 Ie_Vbe_Temp_Pulsed_MJL1302.png90.6 KB · Views: 111
 -
 Ie_Vbe_Temp_Pulsed_MJE15031 ON.png110.7 KB · Views: 106
 -
 Ie_Vbe_Temp_Pulsed_MJE15031-LowI.png163.8 KB · Views: 103
 -
 Ie_Vbe_Temp_Pulsed_D45H11 ON.png146.6 KB · Views: 129
 -
 Ie_Vbe_Temp_Pulsed_2SA2039 ON.png175.9 KB · Views: 134
 -
 Ie_Vbe_Temp_Pulsed_2N3906 Fairchild.png197 KB · Views: 152
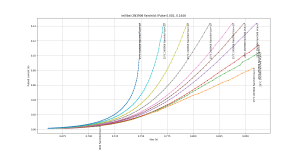
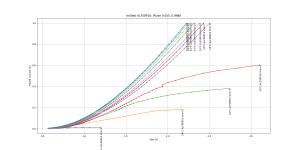
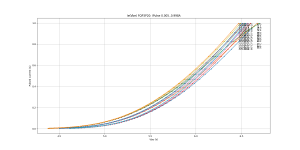
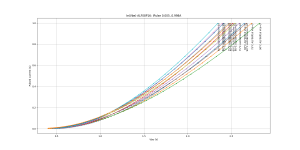
PMOS:
ALF08P16 (note large loss of gm at low Vds, these need headroom)
FQP3P20
IRF9610
IRFP9160
IRFP9310
IRFP9240
ALF08P16 (note large loss of gm at low Vds, these need headroom)
FQP3P20
IRF9610
IRFP9160
IRFP9310
IRFP9240
Attachments
-
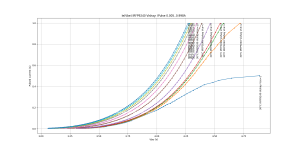 Ie_Vbe_Temp_Pulsed_IRFP9240 Vishay.png188 KB · Views: 87
 -
 Ie_Vbe_Temp_Pulsed_IRFR9310 Vishay.png140.8 KB · Views: 93
 -
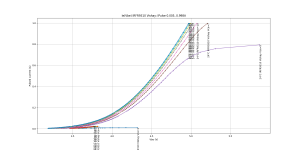
 Ie_Vbe_Temp_Pulsed_IRFP9140 Vishay.png188.8 KB · Views: 86
 -
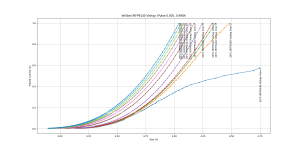
 Ie_Vbe_Temp_Pulsed_IRF9610 Vishay.png170.1 KB · Views: 92
 -
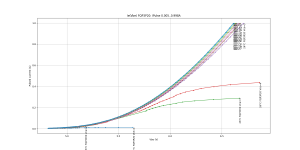 Ie_Vbe_Temp_Pulsed_FQP3P20.png140.9 KB · Views: 100
 -
 Ie_Vbe_Temp_Pulsed_ALF08P16.png168.3 KB · Views: 106

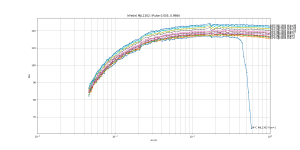
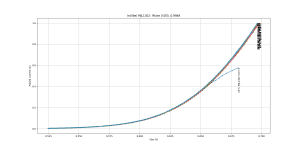
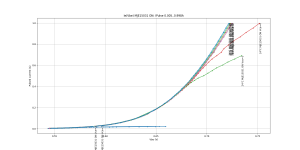
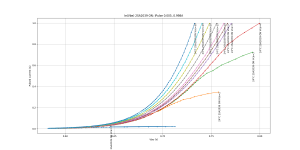
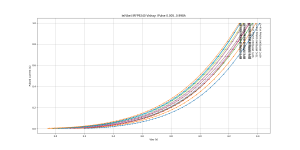
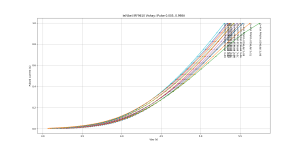
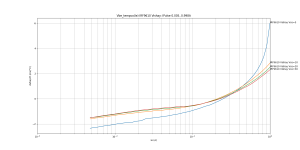
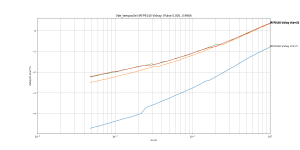
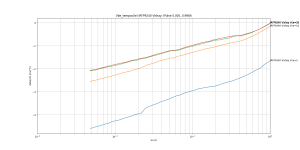
For the PFETs, the same measurement with Vce>50 (so we don't see the gm drop) but with temperature stepped.
First 5 graphs are Vgs vs Is ; last 5 graphs are Vgs tempco at various currents.
First 5 graphs are Vgs vs Is ; last 5 graphs are Vgs tempco at various currents.
Attachments
-
 Ie_Vbe_Temp_Pulsed_IRFP9240 Vishay.png206.9 KB · Views: 87
 -
 Ie_Vbe_Temp_Pulsed_IRFP9140 Vishay.png231 KB · Views: 85
 -
 Ie_Vbe_Temp_Pulsed_IRF9610 Vishay.png189.3 KB · Views: 84
 -
 Ie_Vbe_Temp_Pulsed_FQP3P20.png188.4 KB · Views: 87
 -
 Ie_Vbe_Temp_Pulsed_ALF08P16.png192.2 KB · Views: 108
 -
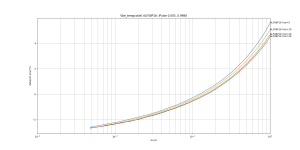 Vbe_tempco(Ie)_Pulse_ALF08P16.png92.6 KB · Views: 96
 -
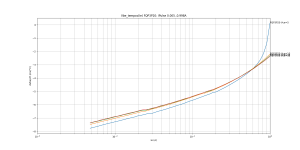 Vbe_tempco(Ie)_Pulse_FQP3P20.png80 KB · Views: 86
 -
 Vbe_tempco(Ie)_Pulse_IRF9610 Vishay.png82.5 KB · Views: 96
 -
 Vbe_tempco(Ie)_Pulse_IRFP9140 Vishay.png78 KB · Views: 88
 -
 Vbe_tempco(Ie)_Pulse_IRFP9240 Vishay.png83.7 KB · Views: 85
Alright, there are way too many plots.
I've uploaded everything to google drive. Feel free to download everything, links never last forever.
diyaudio - Google Drive
Data includes:
- hFe vs Ie at Vce and Temperature. In some graphs hFe greatly increases at low current and high Vce, this means the transistor is near its breakdown voltage.
- Ie vs Vbe at Vce and Temperature
- Vbe tempco vs Current and Temperature. All BJTs are similar but the IRFP240/9240 are interesting for their rather low tempco. ALFETs of course reverse tempco sign as current increases.
- Home
- Amplifiers
- Solid State
- Assorted Pulsed transistor measurements