How to make a tweeter measurement using software ARTA, example from 500hz? In STEPS you can set the measurement frequency, but in ARTA I couldn't find where.
Member
Joined 2003
ARTA doesn't have frequency response limits for impulse response measurements, if that's what you're asking. The average tweeter will be fine full range for low SPL frequency response measurement, especially if you use periodic noise instead of a sine sweep. You always have the ability to include your own high pass filter in line with the device being tested. For delicate ribbon tweeters, a capacitor is a must.
If you are paranoid about it, REW sine sweep allows frequency limits.
If you are paranoid about it, REW sine sweep allows frequency limits.
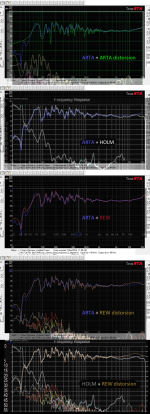
Thank you, with REW I know how measurements are made, but Arta, TrueRTA and Holmimpulse seem more realistic for measurements than REW. If you measure with REW, on the spl graph it looks one way and on the distortion it looks another.
Distorsion graph is not displayed as gated, as far as i know. That may make it look differently.on the distortion it looks another
I'm a little confused about the graphics, they are all smoothed 1/12 only the Arta is 1/24, the measurements are at 1m in the 28m room.

Strange.
Excerpt from
https://www.roomeqwizard.com/help/help_en-GB/html/graph_distortion.html
Excerpt from
https://www.roomeqwizard.com/help/help_en-GB/html/graph_distortion.html
Note that any subsequent changes to the cal files will NOT update the distortion results, they are generated from the cal files that were in use at the time the measurement was made.
The cal files are generated by cross spectrum labs, if that's what you mean, and the graphic interface file is a calibration made by me, I have several calibrated interfaces and microphones. what annoys me is that I can't trust the REW measurements, I would only measure with ARTA but I can't be sure that I don't damage the tweeter.
I just pointed out that applying calibration after measurement might be a reason for deviating response curves in REW.if that's what you mean
just for fun und interest a did a rough overlay of response curves:

there are indeed some strange deviations in the top end. also between ARTA and HOLM.
I was a bit puzzeled by the different distorion graphs until I realized that ARTA shows percentages while REW shows absolute dB values.
Member
Joined 2003
- Home
- Design & Build
- Software Tools
- Arta software measuring tweeter