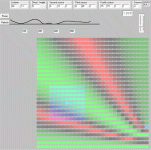
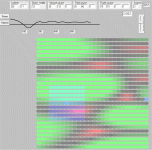
It isn't easy placing speakers for the lower midrange/upper bass and at first I was thinking about the floor and ceiling complementing each other so they don't both contribute to the same nulls.
I wanted to be able to see how big a null was, ie: does it cancel much of the total power in the room? Am I just sitting in a narrow strip of null or just on the edge of one?
The work of Earl Geddes shows that lower frequencies need to be measured spatially so that a region around the listening area is taken into account. My take on this is that the more power there is in the room (the less that has been nulled at some frequency) then the more prominent that frequency will be.
I began writing this last night in the hope that it would answer some of my questions. It is a two dimensional slice looking sideways at a listening room, with the speaker on the right and listener on the left (both in blue). This allows me to visualise a source, with a floor bounce, an optional ceiling bounce (each with adjustable level), and an optional correcting (flanking) woofer that has variable phase and level.
First I was interested in seeing the ratio of nulls to peaks. Then the physical size of the null regions with both floor and ceiling reflections included. Then it occurred to me that I could measure the power response within a region (the light blue box around the listener), and plot this (black trace) so I could achieve a balanced response.
Ultimately this could be expanded to include other reflections and other walls. For now, I'm just trying to get my floor and ceiling to go away. I thought I'd post this on the chance there might be some interest or ideas.

