Akerberg fully differential notch & QA401 - part 1
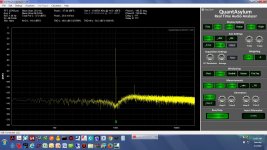
I don't believe I've seen a thread with THD analyzer results from a fully differential notch filter, so here goes. 🙂 I'm using the QA401 analyzer which is also differential.
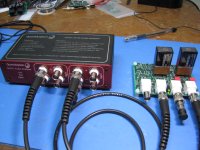
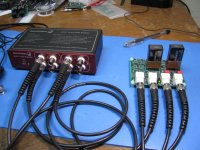
I've received an Akerberg Mossberg differential notch filter board back from fabrication yesterday and built it up. At least part of it - this is just the notch filter. The board also has a gain stage & current buffer section that is bypassed right now. The gain stage can be used in conjunction with the attenuator on the QA401 in exactly the way QA401 posted in their notch blog. There is also a LDO vregulator section I'm not using here, just two 9V batteries for test. The board is sized to fit in a metal B2-080 case from Box Enclosures, but I'm just using it table-top on standoffs here.
The filter is based on the Akerberg Mossberg notch circuit (figure 12) in this TI application note:
http://www.ti.com/lit/an/sloa064a/sloa064a.pdf
BUT there is a known error in TI's circuit! The output of the first stage is reversed as drawn. That is fixed on this board. I've used OPA1632s for the notch filter and the gain stage.
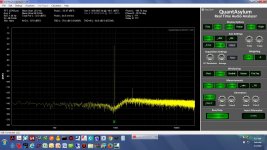
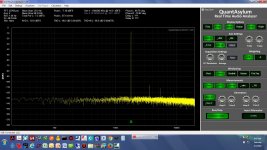
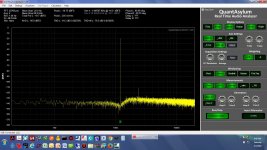
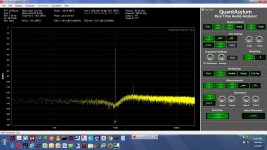
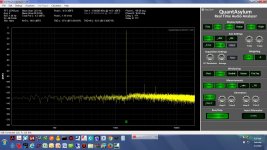
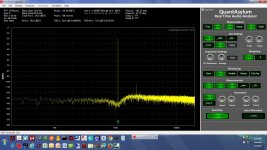
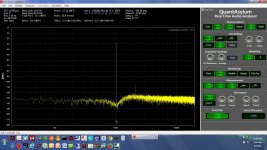
The first set of results here are with the QA401 and the Akerberg filter run as single ended, with one input on each shorted. The second set of results are running fully differentail with the +/- output of the QA401 generator into the +/-input of the notch filter, then the +/- output of the notch into the +/- signal inputs of the QA401.
* The first photo is the test setup.
* The screen grabs - single ended here, not differential, with on input on the QA401 and notch filter shorted - are 1.0KHz, 1.1KHz, 1.2KHz, 1.5KHz, 1.8KHz, 0.95KHz, and 1.05KHz
I don't believe I've seen a thread with THD analyzer results from a fully differential notch filter, so here goes. 🙂 I'm using the QA401 analyzer which is also differential.
I've received an Akerberg Mossberg differential notch filter board back from fabrication yesterday and built it up. At least part of it - this is just the notch filter. The board also has a gain stage & current buffer section that is bypassed right now. The gain stage can be used in conjunction with the attenuator on the QA401 in exactly the way QA401 posted in their notch blog. There is also a LDO vregulator section I'm not using here, just two 9V batteries for test. The board is sized to fit in a metal B2-080 case from Box Enclosures, but I'm just using it table-top on standoffs here.
The filter is based on the Akerberg Mossberg notch circuit (figure 12) in this TI application note:
http://www.ti.com/lit/an/sloa064a/sloa064a.pdf
BUT there is a known error in TI's circuit! The output of the first stage is reversed as drawn. That is fixed on this board. I've used OPA1632s for the notch filter and the gain stage.
The first set of results here are with the QA401 and the Akerberg filter run as single ended, with one input on each shorted. The second set of results are running fully differentail with the +/- output of the QA401 generator into the +/-input of the notch filter, then the +/- output of the notch into the +/- signal inputs of the QA401.
* The first photo is the test setup.
* The screen grabs - single ended here, not differential, with on input on the QA401 and notch filter shorted - are 1.0KHz, 1.1KHz, 1.2KHz, 1.5KHz, 1.8KHz, 0.95KHz, and 1.05KHz
Attachments


Last edited:
Akerberg fully differential notch & QA401 - part 2
Ran out of photo slots. 🙂 Here is part 2, which is now wired as fully differential.
* The first photo is the fully differential notch setup.
* The screen grabs are (fully differential): 1.01KHz, 1.02KHz, 1.05KHz, 1.1KHz, 1.2KHz, 1.5KHz, 1.8KHz, 990Hz, 950Hz. And in all that, I just realized I never captured 1.00KHz! 😱 I'll post that one later.
So the net result... the notch depth when run in single ended mode is actually slightly deeper! But the tradeoff should be common mode cancellation in differential mode.
Attachments
-
 950 KHz differential.jpg243 KB · Views: 133
 -
 990KHz differential.jpg243.1 KB · Views: 117
 -
 1.8 KHz differential.jpg243.2 KB · Views: 124
 -
 1.5KHz differential.jpg242.9 KB · Views: 110
 -
 1.2KHz differtial.jpg243 KB · Views: 111
 -
 1.1KHz differential.jpg243.2 KB · Views: 117
 -
 1.05KHz differential.jpg243.1 KB · Views: 128
 -
 1.02KHz differential.jpg242.8 KB · Views: 163
 -
 1.01KHz differential.jpg243.3 KB · Views: 186
 -
 IMG_4161.JPG322.2 KB · Views: 157
Last edited:
LT Spice sims
Here are some LT spice sims of the Akerberg Mossberg notch circuit. These are with the TI Spice model for the OPA1632 chip.
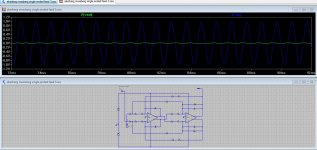
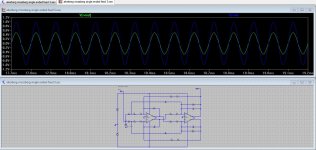
* The first two show overall gain, with the input frequency set way above the (1KHz) notch at 10KHz. The first is single ended input, the second is differential feed. Differential feed results in unity gain, while SE feed results in 50% attenuation.
* The next two show the notch with the frequency set for 995Hz. For some reason I've found that these notch circuits - even the Fliege - simulate about 5Hz off from the real thing. First is SE input, the second is differential input.
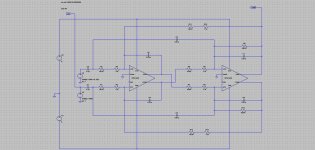
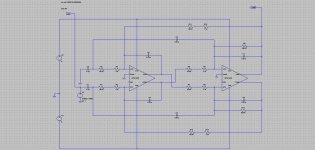
* The last two are just the circuit, trying to make it more readable, but still pretty small. The resistors pairs all over the place are 15.8K in series with 115R. All the capacitors are 0.01uF, except the two input coupling caps which are 4.7uF. The single feedback resistors on the output stage are 49.9K The power supply voltage sources are 9V each.
Here are some LT spice sims of the Akerberg Mossberg notch circuit. These are with the TI Spice model for the OPA1632 chip.
* The first two show overall gain, with the input frequency set way above the (1KHz) notch at 10KHz. The first is single ended input, the second is differential feed. Differential feed results in unity gain, while SE feed results in 50% attenuation.
* The next two show the notch with the frequency set for 995Hz. For some reason I've found that these notch circuits - even the Fliege - simulate about 5Hz off from the real thing. First is SE input, the second is differential input.
* The last two are just the circuit, trying to make it more readable, but still pretty small. The resistors pairs all over the place are 15.8K in series with 115R. All the capacitors are 0.01uF, except the two input coupling caps which are 4.7uF. The single feedback resistors on the output stage are 49.9K The power supply voltage sources are 9V each.
Attachments
-
 Akerberg differential notch f=995Hz.JPG159.9 KB · Views: 128
 -
 Akerberg SE notch f=995Hz.JPG160.2 KB · Views: 132
 -
 Akerberg differential gain f=10KHz.JPG152.1 KB · Views: 135
 -
 Akerberg SE gain f=10KHz.JPG168.2 KB · Views: 160
 -
 Akerberg differential circuit.jpg200.7 KB · Views: 188
 -
 Akerberg SE circuit.jpg200 KB · Views: 192
Last edited:
Hey agdr, if you run your fft with the max window length, you will get much closer to the 1kHz frequency.
Hey agdr, if you run your fft with the max window length, you will get much closer to the 1kHz frequency.
Thanks for the tip! I will give that a try.
Hi agdr, I am trying to use the Akerberg Mossberg bandpass (figure 11) from that same TI app note, and I think it has a similar problem to what you found with the notch but possibly more complicated. Do you have any tips on how to figure that one out?
Hi agdr, I am trying to use the Akerberg Mossberg bandpass (figure 11) from that same TI app note, and I think it has a similar problem to what you found with the notch but possibly more complicated. Do you have any tips on how to figure that one out?
Hi and welcome to the forum! 🙂
Yep figure 11, the bandpass filter, has exactly the same error. In analysis terms what you want is the local feedback on both sides of the differential chip to be negative. As drawn in the TI sheet they have pin 4, the positive output, going back to pin 8, the positive input via a capacitor. That is positive feedback. Same with the other half of the chip, the negative output pin 5 is going to the negative input pin 1, which also works out to be positive feedback.
You want to switch the outputs right at the chip, so that pin 5, the negative output, now hooks to C1B rather than pin 4 and goes on to pin 8, positive input, via the capacitor to give you negative feedback. Same on the other side, the positive output pin 4 now goes to C1A and on to the negative input, pin 1, to give you negative feedback on that side.
The other thing TI's mis-draw messes up is the polarity carried from stage to stage. Notice that as-drawn the positive output of stage 1, pin 4, goes on to the negative input of stage 2, pin 1, via R3A. That causes a voltage inversion. With the stage 1 outputs swapped at the chip you instead will have the negative output of stage 1, pin 5, carrying on to the negative input of stage 2. No inversion and all is good. 🙂 Same with the positive output of stage 1 now going on to the postive input of stage 2.
The local feedback parts on the second stage look correct, same as with the notch filter. C2A and R4A are wired to give you negative feedback, as are C2B and R4B.
As for the mechanism of how these things work, the key is the impedance of the capacitors at the notch frequency. Same is true of the Fliege notch filter. The capacitors will usually have an impedance (resistive part) equal to the resistors in the circuit, which in turn usually forms some sort of bridge that either has the phases opposite and cancelling out when the voltages are summed (keep in mind that capacitors cause phase shift, in addition to that resistive part), or both (in phase) halves of the bridge fed to the + and - op amp inputs so they cancel via the differencing. Away from the notch frequency the resistive part of the capacitor impedance will be lower or higher than the circuit's resistors, so that the bridge voltage sums no longer cancel to zero.
Let's try it! I'm using 0.01uf capacitors simply due to being a standard value. Solving the notch frequency equation in the TI note for resistance with a 1KHz notch, given the 0.01uF capacitance, comes up with 15.915K. I have that split up as 15.8K + 115R = 15.915K in the actual circuit just so the 115R can be varied a bit for fine tuning if needed. The resistive part of the 0.01uF capacitor impedance at the 1KHz notch frequency is: (1 / (2 * pi * 1000 * 0.00000001)) = 15,915 ohms. Q.E.D. 🙂
Last edited:
Thanks so much!!! This worked perfectly in my simulation. 🙂 
Now to try it out in real life on my failing boards... fingers crossed.
Now to try it out in real life on my failing boards... fingers crossed.
Hey that is good news! 🙂
One other suggestion, if you haven't already. In my Akerberg Mossberg notch here I've used 4.7uF film coupling capacitors on the inputs to keep any DC from the source out of the filter, and keep any small amounts of DC feedback from R2A and R2B into the filter input out of the source. Might be something to consider for that bandpass filter too since R4A and R4B should be supplying some DC feeback.
One other suggestion, if you haven't already. In my Akerberg Mossberg notch here I've used 4.7uF film coupling capacitors on the inputs to keep any DC from the source out of the filter, and keep any small amounts of DC feedback from R2A and R2B into the filter input out of the source. Might be something to consider for that bandpass filter too since R4A and R4B should be supplying some DC feeback.
Last edited:
Using the QA401 to characterize the notch filter (or any notch filter)
A big "thank you" here to QuantAsylum for providing some tips on using the QA401's frequency response function to characterize this notch filter! I'm posting the steps here since they may be useful to others in using that FR function for testing notches or for amplifiers. I don't think I've seen these steps posted before.
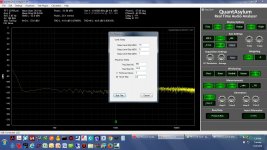
First and foremost QA says the two key things to do are select the "flat top" windowing function for frequency accuracy and un-check the "round to eliminate leakage" check box in the generator set up menu. The first screen capture below shows that box. Unchecking the box causes the generator to produce exactly exact frequencies, like 1.00KHz, rather than rounded.
The frequency response function is hiding in the "test plugins" menu, which only shows up (not grayed out) if the "press to run" software button under "run/stop" is not pressed. The second screen shot below shows the menu that comes up to set the frequency response test parameters.
The bottom half of that dialog is the one that matters here. Since this is intended to be a 1KHz notch filter I'm going to set the start frequency at 990Hz and the end frequency at 1015Hz. Choose "Hz per step" and then I'm picking 0.5Hz for the frequency step size here. That results in (1015Hz - 990Hz) / 0.5Hz = 50 points. On the laptop 50 points takes about 10 minutes to process.
Then hit the "Start Test" button and the next shot below shows what comes up, a "Testing in progress..." dialog. Good time to get a cup of coffee. 🙂 While the test is running all the right pane controls are greyed out as that screen shot shows. You will be able to see the generator frequency stepping in the 4Hz steps up at the top.
The output of the QA401 frequency response test is a comma separated variable (.csv) file that can be read into Excel and then graphed in Excel. When the test is done up comes the windows file selection dialog to let you name the .csv file and pick where you want the file to be stored. Then close the QA401 program - everything else is done with Excel.
In Excel remember that when you pick file->open you have to first select the .csv file type, from the file type drop down list, to make any .csv files in a directory even show up. I'm using Excel 2007. The .csv file type choice is the 5th one down in the list.
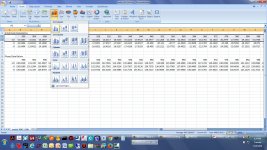
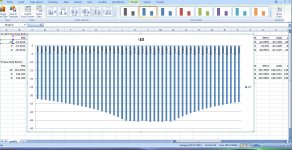
The .csv file read into Excel is in the next screenshot. The 2nd row is the frequency stepping, 900Hz, 904, 908... etc. The 3rd row is the measured dBV values starting with -15.5403, -15.841, etc. Next select those two rows (2nd & 3rd) as shown in the screen grab. Then in the next screen shot select insert->column->2Dgraph. That will produce the graph in the next screen grab, which you can then stretch to be bigger and more visible.
The net result...well, I have some work to do! 😀 The graph makes it easy to see that the center frequency of the filter is 1004Hz rather than the 1000Hz I was expecting. The width of the notch is +/-2Hz around that center. So I need to adjust the resistors in the filter to drop the notch frequency 4Hz. Lol, just the difference between theory, the equations in the TI app note, and the real circuit. 🙂
In fact this 1004Hz result is why I picked the 990Hz to 1015 Hz for this example. I first had used a more narrow range centered right around the expected 1.00KHz and could quickly see from the QA401 FR results the notch center was shifted a bit.
The final plot below is going back through everything above, but now with a wider frquency range to see more of the notch shape. Here the QA401's FR function is set for a start of 900Hz and and end of 1100Hz with 4Hz steps.
Remember that clicking in the lower left corner of any of these plots will make them a bit larger.
A big "thank you" here to QuantAsylum for providing some tips on using the QA401's frequency response function to characterize this notch filter! I'm posting the steps here since they may be useful to others in using that FR function for testing notches or for amplifiers. I don't think I've seen these steps posted before.
First and foremost QA says the two key things to do are select the "flat top" windowing function for frequency accuracy and un-check the "round to eliminate leakage" check box in the generator set up menu. The first screen capture below shows that box. Unchecking the box causes the generator to produce exactly exact frequencies, like 1.00KHz, rather than rounded.
The frequency response function is hiding in the "test plugins" menu, which only shows up (not grayed out) if the "press to run" software button under "run/stop" is not pressed. The second screen shot below shows the menu that comes up to set the frequency response test parameters.
The bottom half of that dialog is the one that matters here. Since this is intended to be a 1KHz notch filter I'm going to set the start frequency at 990Hz and the end frequency at 1015Hz. Choose "Hz per step" and then I'm picking 0.5Hz for the frequency step size here. That results in (1015Hz - 990Hz) / 0.5Hz = 50 points. On the laptop 50 points takes about 10 minutes to process.
Then hit the "Start Test" button and the next shot below shows what comes up, a "Testing in progress..." dialog. Good time to get a cup of coffee. 🙂 While the test is running all the right pane controls are greyed out as that screen shot shows. You will be able to see the generator frequency stepping in the 4Hz steps up at the top.
The output of the QA401 frequency response test is a comma separated variable (.csv) file that can be read into Excel and then graphed in Excel. When the test is done up comes the windows file selection dialog to let you name the .csv file and pick where you want the file to be stored. Then close the QA401 program - everything else is done with Excel.
In Excel remember that when you pick file->open you have to first select the .csv file type, from the file type drop down list, to make any .csv files in a directory even show up. I'm using Excel 2007. The .csv file type choice is the 5th one down in the list.
The .csv file read into Excel is in the next screenshot. The 2nd row is the frequency stepping, 900Hz, 904, 908... etc. The 3rd row is the measured dBV values starting with -15.5403, -15.841, etc. Next select those two rows (2nd & 3rd) as shown in the screen grab. Then in the next screen shot select insert->column->2Dgraph. That will produce the graph in the next screen grab, which you can then stretch to be bigger and more visible.
The net result...well, I have some work to do! 😀 The graph makes it easy to see that the center frequency of the filter is 1004Hz rather than the 1000Hz I was expecting. The width of the notch is +/-2Hz around that center. So I need to adjust the resistors in the filter to drop the notch frequency 4Hz. Lol, just the difference between theory, the equations in the TI app note, and the real circuit. 🙂
In fact this 1004Hz result is why I picked the 990Hz to 1015 Hz for this example. I first had used a more narrow range centered right around the expected 1.00KHz and could quickly see from the QA401 FR results the notch center was shifted a bit.
The final plot below is going back through everything above, but now with a wider frquency range to see more of the notch shape. Here the QA401's FR function is set for a start of 900Hz and and end of 1100Hz with 4Hz steps.
Remember that clicking in the lower left corner of any of these plots will make them a bit larger.
Attachments
-
 QA401 generator rounding deselect_1.jpg357.2 KB · Views: 189
 -
 QA401 FR setup.jpg236.1 KB · Views: 193
 -
 QA401 FR test running.jpg240.2 KB · Views: 181
 -
 Excel data read-in.jpg257.1 KB · Views: 187
 -
 Excel data select.jpg261.7 KB · Views: 182
 -
 Excel data graph select.jpg255.2 KB · Views: 99
 -
 Akerberg notch QA401 scan 990 1015 0.5Hz.JPG222.8 KB · Views: 112
 -
 Akerberg notch QA401 scan 900Hz 1100Hz 4Hz.JPG211.2 KB · Views: 128
Last edited:
reactance not resistance!
Lol in re-reading what I wrote above in post 7 that should be capacitive reactance of course, not resistance. The resistive part of the capacitor impedance is the equivalent series resistance (ESR), which is tiny for these MLCC ceramic parts.
Lol in re-reading what I wrote above in post 7 that should be capacitive reactance of course, not resistance. The resistive part of the capacitor impedance is the equivalent series resistance (ESR), which is tiny for these MLCC ceramic parts.
- Status
- Not open for further replies.
- Home
- Design & Build
- Equipment & Tools
- Akerberg fully differential notch & Q401 - part 1