Post18,
too many wiggles in the LF that just don't match up with any of the RIAA time constants.
too many wiggles in the LF that just don't match up with any of the RIAA time constants.
You are all quite right...
I used my Rigol DS1054 scope, and measured away. What I noticed when I redid the measurements, is that the voltage measurements are different depending on how many waveforms that are visible. I changed vertical and horizontal resolution a little now and then. Although the numbers looked great, they were not at all right.
I have now redone the measurements using the QuantAsylum QA400, with a much lower input signal to avoid clipping. Here are the new graphs. I'd really appreciate if you gave them a look to see if they make sense or not, and if I'm getting it right this time. I welcome all the advice you are willing to give.
I gave away the other phono stage, I assembled a new one without matching or measuring the components. The resistors are metal film 1%, and I believe the Wima MKS2 polyester caps are 5%.
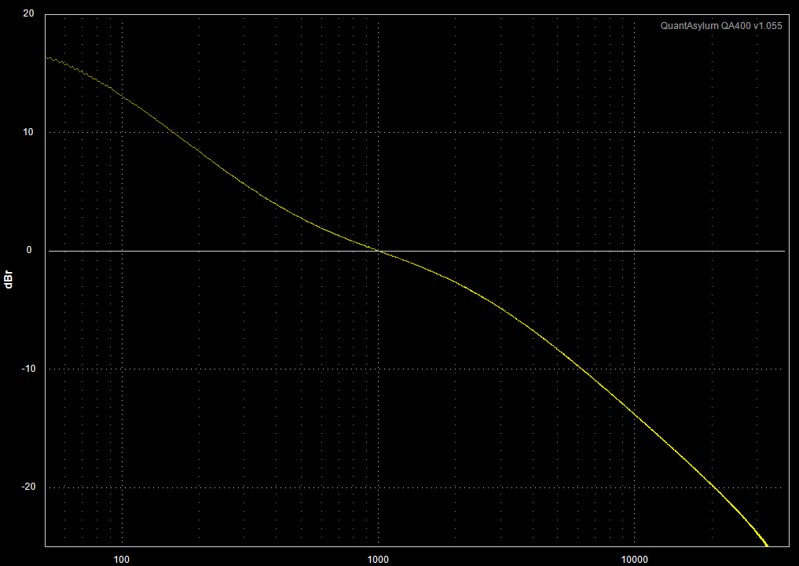
The Y-axis is in dBr, with the 1 kHz signal at 0 dB.
First just the frequency response:
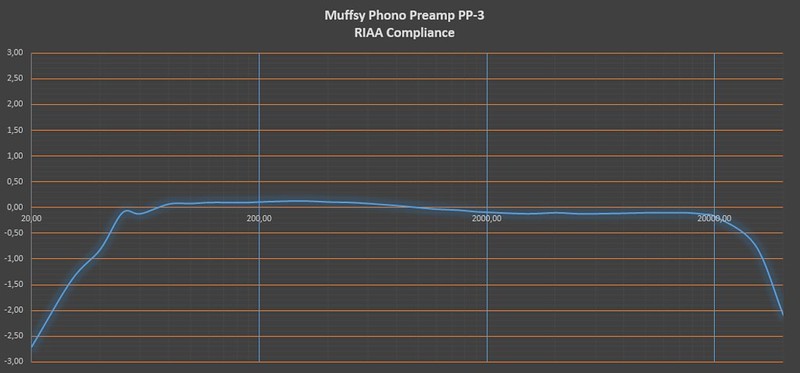
Then the RIAA deviance:
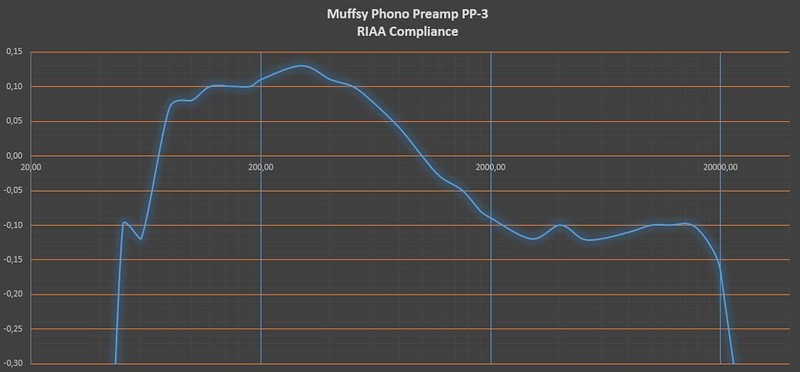
Finally, the RIAA deviance with better resolution:
I used my Rigol DS1054 scope, and measured away. What I noticed when I redid the measurements, is that the voltage measurements are different depending on how many waveforms that are visible. I changed vertical and horizontal resolution a little now and then. Although the numbers looked great, they were not at all right.
I have now redone the measurements using the QuantAsylum QA400, with a much lower input signal to avoid clipping. Here are the new graphs. I'd really appreciate if you gave them a look to see if they make sense or not, and if I'm getting it right this time. I welcome all the advice you are willing to give.
I gave away the other phono stage, I assembled a new one without matching or measuring the components. The resistors are metal film 1%, and I believe the Wima MKS2 polyester caps are 5%.
The Y-axis is in dBr, with the 1 kHz signal at 0 dB.
First just the frequency response:
Then the RIAA deviance:
Finally, the RIAA deviance with better resolution:
Still too many wiggles for 3 RC time constants.
The wiggles are due to measurement errors.
You are trying to measure voltages that are below your measurement systems repeatability and accuracy, or you're not doing it correctly.
The wiggles are due to measurement errors.
You are trying to measure voltages that are below your measurement systems repeatability and accuracy, or you're not doing it correctly.
I expect that you're right, thanks for helping out.
The values are the same each and every time I measure them, but I don't think I can accurately measure dB with two decimals. It's either the built-in signal generator of the QA400, the way it measures the signal, or both. Looking at the frequency response (first graph), the LF is quite squiggly...
Any ideas on a way of interpolating the values, or is that just silly?
I'll try to find a way to improve the measurements. Atm, this seems to be as good as it gets.
Here's the eq filter, nothing out of the ordinary. The simulations show that it should be decent, using only standard value components:
Last edited:
If you were measuring a linear frequency response circuit, then a 1% error represents 0.09dB
You can easily get to 1% at the frequency your voltmeter is guaranteed to be accurate to specification.
But, move outside it's specified frequency range and you don't have any clue to your absolute accuracy.
That's why I use comparison measurements. Absolute accuracy can be out the window and I can still compare two each voltage, equal frequency signals to the repeatable resolution of my voltmeter.
If your resistors and your capacitors are +-1%, then your total spread becomes 4% for a worst case combination. That's 0.35dB
If your resistors AND your capacitors were +-0.1%, then your worst case error becomes +-0.034dB.
Can you measure your resistors to an absolute accuracy of +-0.1%?
Can you measure your capacitors to an absolute accuracy of +-0.1%?
You should be able to insert an inverse RIAA and your circuit into LTspice and check what the error looks like.
If your circuit is perfect and your components tolerances are +-0%, then the LTspice model should report a flat frequency response. Except that opamps aren't perfect. There should be an error if the spice models are good.
Now you can add in component variations and see the errors. You will see the ripples coinciding with the RC time constants.
See if my simplification of 0.35dB is anywhere close for 1% tolerances.
Last edited:
Thanks for the good advice AndrewT,
By using dBr, I thought I was doing comparison measurements. I set the 1 kHz level to 0 dBr, and use that as a reference point. As I said, I don't know if the QA400 can measure the voltages reliably through the whole frequency range, especially with really low frequencies (ref the squiggly LF frequency response).
I'm uncertain on how to measure voltages on the Rigol scope, as they appear to be different depending on horizontal and vertical resolution. I guess I should get a proper RMS voltmeter.
As for measuring components, I got one of these cheap ESR/Transistor testers (http://www.eevblog.com/forum/testgear/$20-lcr-esr-transistor-checker-project/). There are reports that claim they are accurate to +/- 0.1% after calibration.
Here's the LTSpice simulation for this eq filter:
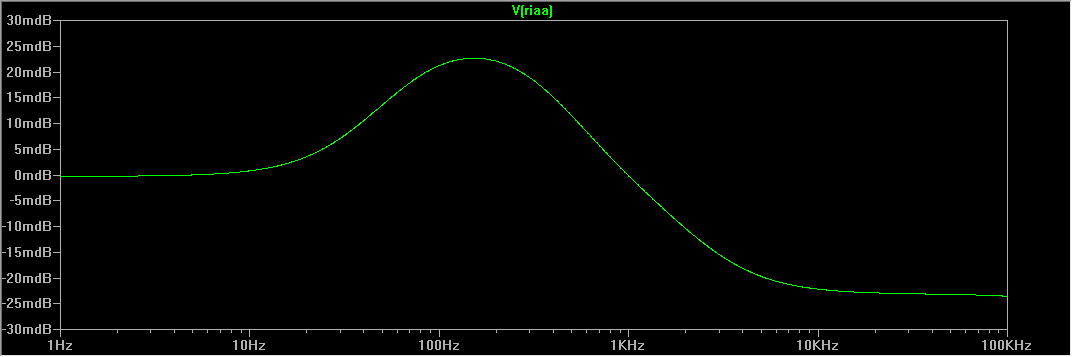
It's actually not that different to what I measured, although not as smooth:
[/QUOTE]
By using dBr, I thought I was doing comparison measurements. I set the 1 kHz level to 0 dBr, and use that as a reference point. As I said, I don't know if the QA400 can measure the voltages reliably through the whole frequency range, especially with really low frequencies (ref the squiggly LF frequency response).
I'm uncertain on how to measure voltages on the Rigol scope, as they appear to be different depending on horizontal and vertical resolution. I guess I should get a proper RMS voltmeter.
As for measuring components, I got one of these cheap ESR/Transistor testers (http://www.eevblog.com/forum/testgear/$20-lcr-esr-transistor-checker-project/). There are reports that claim they are accurate to +/- 0.1% after calibration.
Here's the LTSpice simulation for this eq filter:
It's actually not that different to what I measured, although not as smooth:
[/QUOTE]Comparison example.
Attach a -26dB attenuator in front of a +26dB power amplifier.
The input signal is equal to the output signal, IF the amplifier really has a gain of +26dB.
Now input a 1kHz 1.5Vac to the attenuator, the output signal should come out at the same frequency and the same voltage. It might measure 1.512Vac. This would indicate that the power amp and the attenuator have a difference in gain of 1.008 = 0.07dB
The actual 1kHz gain is +26.07dB
Change the frequency to 10kHz, compare the voltages.
Change the frequency to 20kHz, compare the voltages.
Change the frequency to 30kHz, compare the voltages.
Alternatively you can sweep the frequency and watch the scope for changes in signal height.
Note, if the source changes the input voltage slightly, the scope should track this at the output.
I cheat, I built an accurate switched attenuator that has a range of just over -60dB and steps of 0.05dB
I can set -26.00dB, or by flicking a switch to -26.05dB, or a different switch, to -26.10dB
I use the attenuator to make the input and output signals very close in voltage. Then measure the difference in voltage to obtain the total amplifier gain at this new frequency.
My CHEAP > 20year old 2000 count DMM can compare out to 50kHz, even though it is specified for 40Hz to 200Hz. When I use my 50000 count rms DMM, the results are essentially the same.
It is my opinion that with our resources we amateurs cannot do absolute measurements, but we can do very accurate comparisons.
Have you read about the Hamon divider.
It is capable of comparison accuracy to better than 1ppm using a cheap 2000 count DMM to select the same value resistors.
That reminds me: I need to check the -20.00dB and -40.00dB settings of my attenuator against my two stage Hamon divider.
I know from my building, that the least accurate attenuator steps are the two -20.00dB settings.
I am pretty sure the -10.00dB is close. The -5.00dB setting is very accurate.
Now replace my switched attenuator with a discrete reverse RIAA that one KNOWS is accurate, you can compare the input to the output and you will SEE the errors. It's what LTspice can do.
Last edited:
Thank you very much for sharing this valuable information AndrewT,
I have started that train of thought, and bought a tiny cabinet and connectors for an attenuator so I can use my real signal generator (nothing fancy, a Rigol DG1022).
Your explanation will guide me all the way through. I was not aware of the Hamon divider, I'll certainly look into that to get the accuracy needed. Just a question though, would a simple divider with a multiturn pot do? I should think so, if it can be measured accurately.
I'll also start looking for parts for a reverse RIAA, measuring the components to within a reasonable tolerance and serial/parallel them together to get even closer.
Forget a pot. You cannot get accuracy with that. Tempco will ruin it, movement of the wiper will ruin it.
For a linear Fr use a T attenuator, with accurate 0.1% resistors (trimmed to required values) of low tempco. I used 50ppm/C, 0.1% for the main resistor with the trimmers using 1% 100ppm/C
For your inverse RIAA, you will need similar absolute accuracy components to get an accurate RIAA comparison.
I renamed the .ods spreadsheet file to .txt to allow upload to the Forum.
You will need to rename it back to .ods before you try to open it.
Attachments
Last edited:
That's an invaluable resource AndrewT,
I'm looking at my boxes with Tesla TR161 resistors atm (1% tolerance/100ppm), and figuring that I can make a fixed voltage divider with an exact known ratio/attenuation.
I'll start from there, and keep your spreadsheet for inspiration. 🙂
I don't know how I can thank you enough though...
I'm looking at my boxes with Tesla TR161 resistors atm (1% tolerance/100ppm), and figuring that I can make a fixed voltage divider with an exact known ratio/attenuation.
I'll start from there, and keep your spreadsheet for inspiration. 🙂
I don't know how I can thank you enough though...
Read about Hamon if you NEED an exact 1/10th divider.
1% resistors in a Hamon divider give a worst case accuracy of the divider of about 0.0001 i.e. less than 1part per ten thousand, or 100ppm. It actually works out at ~ 2/3rds of that, or better than 70ppm.
If you use your DMM to match the resistors to 0.5% you get (0.005)² *2/3 ~ 17ppm
Conrad mentions using different groups of resistors rather than just the 3 specifically to get that 9:1 ratio (1/10th), a group of 2 gives 2:½ = 4:1 (1/5th), a group of 4 gives 4:¼ = 16:1 (1/17th) etc. You can see why Hamon did the 3group.
You could use these to calibrate the different scales of your DMM.
Looking on this schematic: https://hackaday.io/project/5676/gallery#e393f5a3633bec981bdc156b3ed3a91a
i think some 47-100uf elcaps paralele with R4 and R7 would help more in lowering noise floor of regulators.
i think some 47-100uf elcaps paralele with R4 and R7 would help more in lowering noise floor of regulators.
Looking on this schematic: https://hackaday.io/project/5676/gallery#e393f5a3633bec981bdc156b3ed3a91a
i think some 47-100uf elcaps paralele with R4 and R7 would help more in lowering noise floor of regulators.
The noise floor is already really low, but I'll definitely keep that in mind. I'm sorta set on keeping the width at 84 mm, so it will fit in a standard cabinet. (The one I'm using is a B0905.) These constraints means having to find a compromise.
You do mean R4 and R6, right?
If I wanted to check RIAA accuracy, I'd probably try doing the EQ part on software level these days, with just an attenuator on the preamp input. (Keeping either the playback or record end of the signal chain floating, i.e. a battery-operated notebook or whatnot, is much recommended.) No worries about parts tolerances at all.
Not sure where to get a good inverse RIAA though, I don't think the EQ option in Audacity is suited at this level (it appears to be an FIR job anyway). The transfer function is easily modeled in LTspice by way of a behavioral source with Laplace transform but I wouldn't know how to get a WAV file back out of it. Scilab looks like it can both read and write WAVs, so that may be an option (the RIAA/IRIAA would have to be created as a continuous-time transfer function and converted to discrete-time, but I've found instructions on how to do both). I might just give that a shot for fun.
All of that being said, a good input R/C match is probably more important than sub-0.3 dB RIAA accuracy.
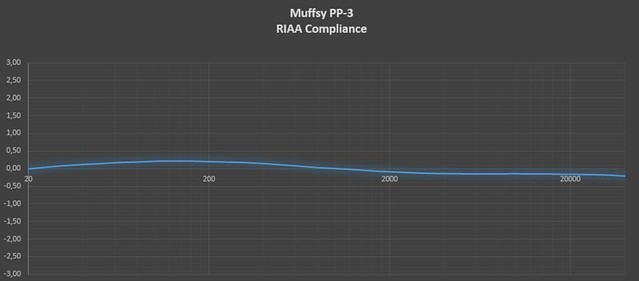
Hi, does this look more sane? I'm not sure about the HF this time...
Measurements are done with a Uni-T UT61D, True RMS DMM. I had to use several 1 kHz references to get the highest resolution from the multimeter for each frequency.
The resistors (1% metal film) and capacitors (5% Wima MKS 2) have been taken straight out of the bag, with no matching.
Measurements were taken from 20 - 40.000 Hz. The largest deviances were +0.21 dB (100, 120, 150 and 180 Hz), -0.20 dB (20 kHz). The values for 30 and 40 kHz were -0.57 and -0.90 dB.
RIAA Compliance, X-axis -3 to +3 dB:

RIAA Compliance, X-axis -0.7 to +0.45 dB:

Measurements are done with a Uni-T UT61D, True RMS DMM. I had to use several 1 kHz references to get the highest resolution from the multimeter for each frequency.
The resistors (1% metal film) and capacitors (5% Wima MKS 2) have been taken straight out of the bag, with no matching.
Measurements were taken from 20 - 40.000 Hz. The largest deviances were +0.21 dB (100, 120, 150 and 180 Hz), -0.20 dB (20 kHz). The values for 30 and 40 kHz were -0.57 and -0.90 dB.
RIAA Compliance, X-axis -3 to +3 dB:
RIAA Compliance, X-axis -0.7 to +0.45 dB:
That makes more sense.
Thanks a lot AndrewT,
I'll have a look at the HF accuracy, but it's good to know I'm on the right track.
Thanks for the guidance, measuring is an art in itself. 🙂
I can't tell whether it is the Rigol DG1022 signal generator that has a lower output at higher frequencies, or if it is the Uni-T UT61D that can't accurately measure them.
I have at least measured values directly from the DG1022 and seen that the DMM shows a lower value than the signal generator says it's delivering. I then set the SG to deliver the same values as the measured output for each frequency and adjusted for this error.
What I end up with is largely the same graph, but with better frequency response from 18 kHz and up. I'm not able to consistently measure better than 0.01 dB, so I'm using only two decimals. The result is that the graph isn't perfectly smooth.
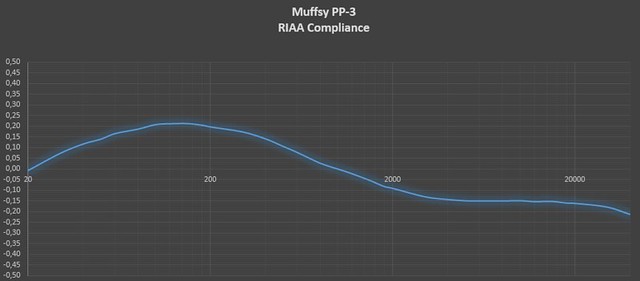
The deviance at 20 Hz is -0.01 dB, it's up to +0.21 dB from 100-180 Hz, and down to -0.16 dB at 20 kHz. The deviance goes down to -0.21 dB at 40 kHz, and I haven't measured beyond that.
Thanks for all the guidance along the way AndrewT, I have certainly learned a lot from you.
I have at least measured values directly from the DG1022 and seen that the DMM shows a lower value than the signal generator says it's delivering. I then set the SG to deliver the same values as the measured output for each frequency and adjusted for this error.
What I end up with is largely the same graph, but with better frequency response from 18 kHz and up. I'm not able to consistently measure better than 0.01 dB, so I'm using only two decimals. The result is that the graph isn't perfectly smooth.
The deviance at 20 Hz is -0.01 dB, it's up to +0.21 dB from 100-180 Hz, and down to -0.16 dB at 20 kHz. The deviance goes down to -0.21 dB at 40 kHz, and I haven't measured beyond that.
Thanks for all the guidance along the way AndrewT, I have certainly learned a lot from you.
Last edited:
- Status
- Not open for further replies.
- Home
- Source & Line
- Analogue Source
- AK phonostage