This thread is about assessing the acoustic properties of films such as used in ESL by means of measurements and/or by theoretical modelling. We may not only discuss the acoustic properties as such, but also the methods and the models, theirs strengths and theirs llmits. No less, no more. So please be aware that we might NOT want to discuss subjectivism v.s. objectivism here. For sharing about your sonic preferencies and the like, you are kindly invited to please go elsewhere or open your own thread.
As already mentionned in another thread, I got a nice collection of five different types of film available from eraudio.com.au (thank you to Rob Mackinlay for providing this test samples for free along with another purchase) . During the evolution of this aforementionned thread, quadesl.nl joined in and provided me a free (many thanks to Frans Wouters and his forist brother here aka wout31) sample of yet another and complementary 3.0um film. So the actual films collection under test is as follows:
BOPET 3.0um - D30 - Dupont Mylar
BOPET 3.2um - T32 - Toray PET
BOPP 3.8um - B38 - A Polypropylen film made in Germany with an equivalent mass of 2.8um PET
BOPET 4.2um - M42 - Dupont Mylar
BOPET 6.0um - X60 - ICI Melinex (original product, dating from 1977)
HS 8.0um - H80 - A heat-shrink film which is a co-extrusion of two types. The exact formulation is not known.
I got many tips and infos in the former thread which lead to some modifications of the initial test frame, which essentially became slimmer. Thank your for all these open inputs here, and thank you for the inputs and advices by PN and by mail (Rob Mackinlay).
For this test series, the film gets completely mounted on a interchangeable sub-frame system. Being tensionned and completely framed around the borders of a quadratic frame of 60x60cm, the mounted and tensionned films will show border reflection patterns like in a real-life assembled system. The tensionning of the film before fixing onto the subframe was chosen at approx. 12 Newton for 16 location at the film's square periphery. The tensionning unfortunately remained not strictly static after having fully assembled the subframe to the main frame, so there was some variation of the tensionning from test to test and from film to film sample. Nevertheless, in all cases the tension of all test candidates might have very well been in a range of e.g. a fully assembled ESL dust cover by the time of the measurement.
Testing was basically performed as described in the former thread for transmission/transparency, reflection and induced noise (=damping). The film was always stimulated passively, either by the energy of a sound wave, or the dropping of a 4mm steel sphere onto it. Some of these tests seemed to reveal quite obviously some specific film properties. This was the nice side. The more awkward side was given by the fact that even small variances of the setup may have contributed to not so obvious results. And while some analysis methods allowed clear conclusions, others did not quite so.
Whenever possible, some calibration was applied. E.g. for the transparency/reflection test first the empty frame (no film fitted) was measured to assess the influence of the frame itself at the two different room locations: The sound source was static. The microphone was static. For the transparency measurements the target location of the frame was 86 mm in front of the microphone, e.g. between the sound source and the microphone. For the reflections measurement, the target locacion of the frame was further away from the sound source at 172mm behind the microphone. So the income time of the reflection was approx. 1ms. Testing for the empty frame effects revealed distinct artefacts attributed to the frame for both frame locations. This was quite unexpected to me, because the frame was made of slim 16mm x 16mm quadratic-sectionned steel tubes.

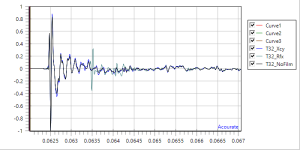
This is a mixed-phase impulse graph showing a time section 0.5ms in front and 4.5ms behind the initial amplitude surge of the pulse.
In magnitude domain and after some processing the frame artefacts look like this:

So, once the frame will be fitted with a film, everything outside the envelope of these curves, and certainly everything < -2dB and > +2dB might be considered as film artefacts/properties. Good to know.
At the other extreme of the calibrations horizont is the full reflective structure. The frame was fitted with a hard fiber board instead of a nothing:

The max. reflection amplitude (grey) gets about 80% of the amplitude of the direct, no film (in this case no board) response. And another thing occurs as a measurement and processing artefact: The transparancy impulse (blue) is much more intense than in the previous graph. In fact it should be lower. This has a simple reason which gets more obvious in the next graph:

The sinesweep recorder gui of Acourate has an option to normalize the pulse after a measurement. If enabled, this option processess weak signals with a compensating amplification. I do have this option enabled as a standard. In reality, the sound intensity behind the board is weaker than in front of it. This then gets processed with the amplification in order to normalize it. Therefore, in this resulting graph the signal behind the board paradoxically appears some 15dB ... 18dB more intense than the one in front of the board. In reality, the rear signal is down by 15dB ... 18dB. You may note that the Y-axis has exceptionally been scaled to +20dB (instead of +8dB) because of the high amplitude of the blue transparency curve.
You also see that in this setup the max. possible comb filter-type, reflection-caused ripple is +6 / -8dB.
So then, how do the films present themselves applying this kind of measurements (transparency/reflection) and processing:
BOPET 3.0um - D30 - Dupont Mylar:


BOPET 3.2um - T32 - Toray PET:


BOPP 3.8um - B38 - The Polypropylen film made in Germany with an equivalent mass of 2.8um PET:


BOPET 4.2um - M42 - Dupont Mylar:


BOPET 6.0um - X60 - ICI Melinex (original product, dating from 1977)


HS 8.0um - H80 - The heat-shrink film which is a co-extrusion of two types. The exact formulation is not known.


Remember that the delta between the two curves (blue = transparency, grey = reflection) are correlated to the transmission damping: The more damping, the higher the delta.
That's it for the moment ... A presentation of data from the induced noise (=damping) test may follow.
As already mentionned in another thread, I got a nice collection of five different types of film available from eraudio.com.au (thank you to Rob Mackinlay for providing this test samples for free along with another purchase) . During the evolution of this aforementionned thread, quadesl.nl joined in and provided me a free (many thanks to Frans Wouters and his forist brother here aka wout31) sample of yet another and complementary 3.0um film. So the actual films collection under test is as follows:
BOPET 3.0um - D30 - Dupont Mylar
BOPET 3.2um - T32 - Toray PET
BOPP 3.8um - B38 - A Polypropylen film made in Germany with an equivalent mass of 2.8um PET
BOPET 4.2um - M42 - Dupont Mylar
BOPET 6.0um - X60 - ICI Melinex (original product, dating from 1977)
HS 8.0um - H80 - A heat-shrink film which is a co-extrusion of two types. The exact formulation is not known.
I got many tips and infos in the former thread which lead to some modifications of the initial test frame, which essentially became slimmer. Thank your for all these open inputs here, and thank you for the inputs and advices by PN and by mail (Rob Mackinlay).
For this test series, the film gets completely mounted on a interchangeable sub-frame system. Being tensionned and completely framed around the borders of a quadratic frame of 60x60cm, the mounted and tensionned films will show border reflection patterns like in a real-life assembled system. The tensionning of the film before fixing onto the subframe was chosen at approx. 12 Newton for 16 location at the film's square periphery. The tensionning unfortunately remained not strictly static after having fully assembled the subframe to the main frame, so there was some variation of the tensionning from test to test and from film to film sample. Nevertheless, in all cases the tension of all test candidates might have very well been in a range of e.g. a fully assembled ESL dust cover by the time of the measurement.
Testing was basically performed as described in the former thread for transmission/transparency, reflection and induced noise (=damping). The film was always stimulated passively, either by the energy of a sound wave, or the dropping of a 4mm steel sphere onto it. Some of these tests seemed to reveal quite obviously some specific film properties. This was the nice side. The more awkward side was given by the fact that even small variances of the setup may have contributed to not so obvious results. And while some analysis methods allowed clear conclusions, others did not quite so.
Whenever possible, some calibration was applied. E.g. for the transparency/reflection test first the empty frame (no film fitted) was measured to assess the influence of the frame itself at the two different room locations: The sound source was static. The microphone was static. For the transparency measurements the target location of the frame was 86 mm in front of the microphone, e.g. between the sound source and the microphone. For the reflections measurement, the target locacion of the frame was further away from the sound source at 172mm behind the microphone. So the income time of the reflection was approx. 1ms. Testing for the empty frame effects revealed distinct artefacts attributed to the frame for both frame locations. This was quite unexpected to me, because the frame was made of slim 16mm x 16mm quadratic-sectionned steel tubes.
This is a mixed-phase impulse graph showing a time section 0.5ms in front and 4.5ms behind the initial amplitude surge of the pulse.
- Black: The Null-measurement as the biasing reference. No frame, no film, nothing but the room response.
- Blue: The empty frame (no film fitted) is located at the location for transparency measurements, e.g. 8.6 cm in front of the microphone.
- Grey: The empty frame (no film fitted) is located at the location for reflection measurements, e.g. 17.2cm behind the microphone.
- Red: This is a synthesized pulse delayed by 1ms which typically would show up in a measurement if a reflective plane/film would have been fitted.
In magnitude domain and after some processing the frame artefacts look like this:
So, once the frame will be fitted with a film, everything outside the envelope of these curves, and certainly everything < -2dB and > +2dB might be considered as film artefacts/properties. Good to know.
At the other extreme of the calibrations horizont is the full reflective structure. The frame was fitted with a hard fiber board instead of a nothing:
The max. reflection amplitude (grey) gets about 80% of the amplitude of the direct, no film (in this case no board) response. And another thing occurs as a measurement and processing artefact: The transparancy impulse (blue) is much more intense than in the previous graph. In fact it should be lower. This has a simple reason which gets more obvious in the next graph:
The sinesweep recorder gui of Acourate has an option to normalize the pulse after a measurement. If enabled, this option processess weak signals with a compensating amplification. I do have this option enabled as a standard. In reality, the sound intensity behind the board is weaker than in front of it. This then gets processed with the amplification in order to normalize it. Therefore, in this resulting graph the signal behind the board paradoxically appears some 15dB ... 18dB more intense than the one in front of the board. In reality, the rear signal is down by 15dB ... 18dB. You may note that the Y-axis has exceptionally been scaled to +20dB (instead of +8dB) because of the high amplitude of the blue transparency curve.
You also see that in this setup the max. possible comb filter-type, reflection-caused ripple is +6 / -8dB.
So then, how do the films present themselves applying this kind of measurements (transparency/reflection) and processing:
BOPET 3.0um - D30 - Dupont Mylar:
BOPET 3.2um - T32 - Toray PET:
BOPP 3.8um - B38 - The Polypropylen film made in Germany with an equivalent mass of 2.8um PET:
BOPET 4.2um - M42 - Dupont Mylar:
BOPET 6.0um - X60 - ICI Melinex (original product, dating from 1977)
HS 8.0um - H80 - The heat-shrink film which is a co-extrusion of two types. The exact formulation is not known.
Remember that the delta between the two curves (blue = transparency, grey = reflection) are correlated to the transmission damping: The more damping, the higher the delta.
That's it for the moment ... A presentation of data from the induced noise (=damping) test may follow.
Attachments
Last edited: