Raw drivers + FIR response as measured at 1m with pile of blankets

And I also played with the sub timing some more:

Bit weird that the correct timing shows a wider dip.


Wavelet for sub with negative polarity

Positive polarity

And I also played with the sub timing some more:
Bit weird that the correct timing shows a wider dip.
Wavelet for sub with negative polarity
Positive polarity
Ran a couple more measurements and based on individual driver respons decided to go with LR8 for woofer-mid crossover.
Top LR4 bottom LR8

It's starting to look very decent for a LP measurement.
I also tried to brute force FIR it and just put a phase linearisation filter over the right channel. I expected more from it considering the phase and the wavelet view. This does max out my DSP power (1023 taps for woofers, 800 for mids and 150 for tweets) DSP load with 2 times 1023 extra for left and right channel was 92 on core 1 and 103 on core 2. So without reshuffling the channels to even the load 1023 taps for separate channel phase linearization is too much.


normal wavelet

phase linearized wavelet

Top LR4 bottom LR8
It's starting to look very decent for a LP measurement.
I also tried to brute force FIR it and just put a phase linearisation filter over the right channel. I expected more from it considering the phase and the wavelet view. This does max out my DSP power (1023 taps for woofers, 800 for mids and 150 for tweets) DSP load with 2 times 1023 extra for left and right channel was 92 on core 1 and 103 on core 2. So without reshuffling the channels to even the load 1023 taps for separate channel phase linearization is too much.
normal wavelet
phase linearized wavelet

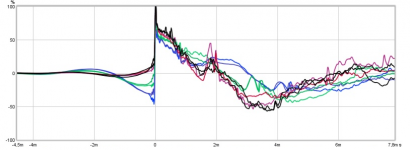
So I did a bunch of measurements of the speakers and separate drivers throughout the room at 0.5m, 1m and 2.5m from the speakers and at the central listening position (also at 2.5m)
0.5m

1m

2.5m

2.5m vs central listening position

0.5m
1m
2.5m
2.5m vs central listening position
Interesting curves looks mid bandpass have worst ripple errors with distance, can't see clear if you shoot for flat or tonal curve falling as frq goes up but it could look raise level for W and see if it helps on any ripple in W/M area.
How does SR look for system sum at those three distances, it could maybe reveal if settings for acoustic offset with distance is a little bit off and create some of that ripple.
STEP comparison for various distances

Looks quite good at 2.5m
I'm shooting for a 10dB falling response 20Hz-20KHz to start with ;-)
The woofer is on the floor now so it doesn't have floor bounce anymore in comparison to mid.
Looks quite good at 2.5m
I'm shooting for a 10dB falling response 20Hz-20KHz to start with ;-)
The woofer is on the floor now so it doesn't have floor bounce anymore in comparison to mid.
Last edited:
Thanks SR thought was in that no of the three passbands is within 1/4 wavelenght that maybe it help a bit into XO regions ripple that offset was calibrated at long distance LP.
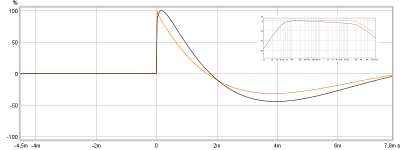
Of course don't expect peak close to 2mS to be tweeter or mid siting there, but have little worry how SR is represented up against a reference se next picture.

If system stopbands are minimum phase and response is flat all over SR will have sharp edge at 100% peak (tweeter) as orange curve, but if same is added a tonal curve falling as frq goes higher then peak (tweeter) will not be higher than 80-90% because of the lower amplitude level, then raises soft up to 100% as the frq goes into lower band where amplitude level increase.

Here is the reference black SR curve from above and where the three passband peaks relative sit to make that sum for a 50Hz-22kHz IIR domain with tonal curve falling the higher in frq and linear phase XO points at 300Hz LR8 and 2500Hz LR4.

Why upper 30% of peak is so thin and not ala the reference is not to know but should be pretty easy run some sweeps looking at SR tab and for each sweep take off speaker cable for one of each band at a time or lower gain level, then afterwards should be possible get hints to decode down the time line if bandpasses sits where they expected to.
Of course don't expect peak close to 2mS to be tweeter or mid siting there, but have little worry how SR is represented up against a reference se next picture.
If system stopbands are minimum phase and response is flat all over SR will have sharp edge at 100% peak (tweeter) as orange curve, but if same is added a tonal curve falling as frq goes higher then peak (tweeter) will not be higher than 80-90% because of the lower amplitude level, then raises soft up to 100% as the frq goes into lower band where amplitude level increase.
Here is the reference black SR curve from above and where the three passband peaks relative sit to make that sum for a 50Hz-22kHz IIR domain with tonal curve falling the higher in frq and linear phase XO points at 300Hz LR8 and 2500Hz LR4.
Why upper 30% of peak is so thin and not ala the reference is not to know but should be pretty easy run some sweeps looking at SR tab and for each sweep take off speaker cable for one of each band at a time or lower gain level, then afterwards should be possible get hints to decode down the time line if bandpasses sits where they expected to.
Attachments

Last edited:
STEP for right speaker and drivers at 2.5m

STEP for left speaker and drivers at 2.5m

No idea why woofer STEP is reversed, the drivers sum well. But then I don't use a timing reference.
STEP for left speaker and drivers at 2.5m
No idea why woofer STEP is reversed, the drivers sum well. But then I don't use a timing reference.
Ignore reflections for mid and tweeter and where they sit down the time line they look fine regarding polarity, point that deviate from the reference (reversed) is tweeter step do not go out to 100% negative direction before going lower numbers into positive direction.
I don't think it's a problem, I checked a bunch of older measurements and almost never get tweeter step to go to -100%, best I could find was -90% but most are between -50% and -60% like here. Any idea what might be the cause?
Can only speculate here and would investigate especially if it can help the comp filter looking scheme in area where tweeter and mid cooperate, thought is phase is over or under corrected some way for tweeter bandpass, but also we should notice those SR was at 2,5 meter maybe they were actual as the reference in nearfield where FIR filter settings probably was created.
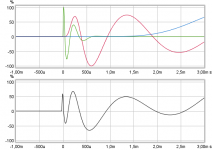
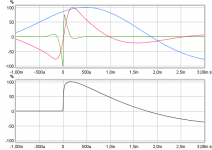
If it can help here is how it looks for SR being ordinary IIR domain all over verse IIR system passband with XO points FIR linearized.
Pure IIR domain 50Hz-22kHz with XO points LR8 300Hz plus LR4 2500Hz and B&K tonal curve.

Same as above but XO points phase is FIR linearized.

If it can help here is how it looks for SR being ordinary IIR domain all over verse IIR system passband with XO points FIR linearized.
Pure IIR domain 50Hz-22kHz with XO points LR8 300Hz plus LR4 2500Hz and B&K tonal curve.
Same as above but XO points phase is FIR linearized.
Attachments
FIR-Delay
Hi Byrtt,
that looks great !🙂
Can you tell me with which program and with which signal
you have corrected the term?
Did you take 3 individual measurements or does it work all at once?
Thanks in advance,
Rainer
Hi Byrtt,
that looks great !🙂
Can you tell me with which program and with which signal
you have corrected the term?
Did you take 3 individual measurements or does it work all at once?
Thanks in advance,
Rainer
Hi Rainair,
Its pure textbook synthetic simulation and very pratical way to do target/simulation/understanding for diy things how stuff works out in perfect textbook domain. No signals are used but in free Rephase one can create whatever IR-wav file one can wish about then save it as 64bit IEEE stereo or mono wav-file, and when imported into free REW one can sum those band-passes or even command times or divide on "All SPL" tab in REW. Over in REW the hard part is keep an eye on IR alignment, normal if you import pure IIR impulses you need to push button "Estimate IR delay" but because woofer IR is often not so sharp you need further visual manual move IR alignment relative to time zero, for the most imported FIR IR don't need any manual alignment. I'm not the sharpest guy in town so it took me some learning curve to understand and do it well but its nice possibility. Over in Rephase its relative easy to create pure IIR (minimum phase) or pure FIR (linear phase) band-passes, the hard part can be create mixes of IIR and FIR or simulate say a 3 way IIR system with two IIR XO points, but its often doable setting the first tab "General" to invert "polarity" and invert "time" and tell own brain to think a bit upside/down 😛.
Its pure textbook synthetic simulation and very pratical way to do target/simulation/understanding for diy things how stuff works out in perfect textbook domain. No signals are used but in free Rephase one can create whatever IR-wav file one can wish about then save it as 64bit IEEE stereo or mono wav-file, and when imported into free REW one can sum those band-passes or even command times or divide on "All SPL" tab in REW. Over in REW the hard part is keep an eye on IR alignment, normal if you import pure IIR impulses you need to push button "Estimate IR delay" but because woofer IR is often not so sharp you need further visual manual move IR alignment relative to time zero, for the most imported FIR IR don't need any manual alignment. I'm not the sharpest guy in town so it took me some learning curve to understand and do it well but its nice possibility. Over in Rephase its relative easy to create pure IIR (minimum phase) or pure FIR (linear phase) band-passes, the hard part can be create mixes of IIR and FIR or simulate say a 3 way IIR system with two IIR XO points, but its often doable setting the first tab "General" to invert "polarity" and invert "time" and tell own brain to think a bit upside/down 😛.
- Status
- Not open for further replies.
- Home
- Loudspeakers
- Multi-Way
- Achilles FIR 4-way