Hmmmm...
His words were the input is "1mVpp - 10Vpp, adjustable, ALL POSITIVE". I read that as the minimum voltage of the wave always being 0V, with the peak voltage changing, but it could just as easily be +/- X volts around a centre value of 5V, both would give the graph in the example picture. So more information is needed 🙂
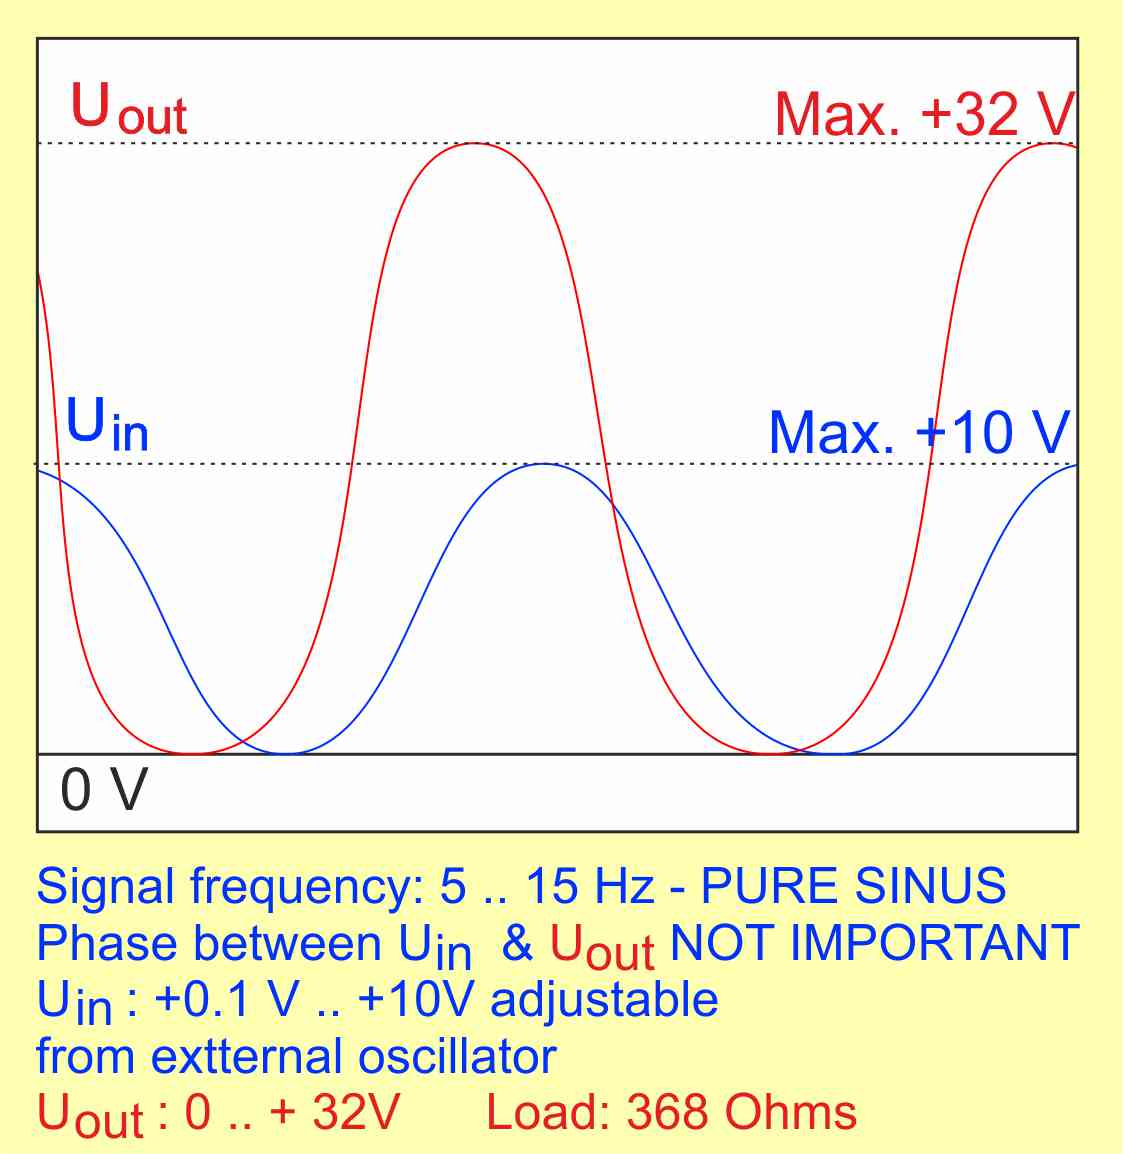
His words were the input is "1mVpp - 10Vpp, adjustable, ALL POSITIVE". I read that as the minimum voltage of the wave always being 0V, with the peak voltage changing, but it could just as easily be +/- X volts around a centre value of 5V, both would give the graph in the example picture. So more information is needed 🙂
Yes. BTW your solution could also work if the function gen is set to 10V, with the right DC added, and then to a level control.
Jan
Jan