having done what I done I now understand your post! It's a learning project 👍What I personally would do is much different, so I'll not say too much. These are my thoughts.
Nothing really changes in 5 degree increments.
The software predicts results, but if there's a problem with some of the measurements, you're screwed.
I would work with on axis only. (Initially )
I would rather make a x-over flat on axis, and then measure it two more times at 45 and 60 degrees off axis, to see if it does as intended. If it does, store that x-over information.
If you then want to take another hundred measurements, go for it.
When you get home, and sim some x-overs, you can compare the sim estimate, with the reality of the one real / stored x-over.
The big thing you want, is to have 1k down to 200hz dialed in before you leave. (ie, the woofer to mid x-over. ) Anything else can be done at home if needed. .

Hope to do some outdoor measurements this weekend! Wind forecast looks ok.
I would assume that by now you are taking measurements that verify your sims. I don't recall seeing any actual measurements of the whole speaker using x-overs. Keep in mind that the measurement distance matters when the drivers are spaced wide like yours. So the woofer / mid summation might be slightly different at 1m vs 2m, or at different heights. I don't think there's any problem with the tweeter x-over, but I would not go under 1m. Outdoors you may be able to get a good on axis measurements at 2m, all the way down to 300hz, or lower without reflections.Hope to do some outdoor measurements this weekend! Wind forecast looks ok.
Another option I meant to mention was possibly adding padding resistors on the tweeter to help with the resonance. Maybe something to try later.
Last edited:
Here we go, measurements attempt 5. Outdoors. 2m from floor. 1m mic distance. I think this time even phase recorded OK (at least within the intended eventual operating range of the drivers)
Tweeter:

Midrange:

Woofers:

Tweeter:
Midrange:
Woofers:
Nice!Quick VCAD sim using the above.
The directivity plot will be slightly different (worse) if you include the vertical driver distances.
If you measured all of them at tweeter level, the vertical directivity will be correct on axis, but not for all other angles.
All drivers measured at driver centre height (woofers in the middle).
What is the right way to reflect this in the vcad sim?
What is the right way to reflect this in the vcad sim?
If you measured each driver on its axis, Tw is 0,0,0 - Mid is 0,-120,0 - Wf is 0,-300,0
If you did non change the mic position for the drivers measurements, Wf is 0,0,0 - Mid is 0,180,0 -Tw is 0,300,0
Obviously, modify the Y values with the real ones.

If you did non change the mic position for the drivers measurements, Wf is 0,0,0 - Mid is 0,180,0 -Tw is 0,300,0
Obviously, modify the Y values with the real ones.
I don't know why but I was just expecting some pics of the BBQ and now I am sad...🙂A day in the garden.
Even the trees bend to listen! :-DA day in the garden.
The only shaded spot. It was +33C. But then there was beer, pool and bbq. I cooked 24hr smoked pork belly. And the hosts brought my childhood cakes from my hometown, 9hrs flight away. Good times were had. No time for food pics.
Thank you. I will try updating the sim.If you measured each driver on its axis, Tw is 0,0,0 - Mid is 0,-120,0 - Wf is 0,-300,0
If you did non change the mic position for the drivers measurements, Wf is 0,0,0 - Mid is 0,180,0 -Tw is 0,300,0
Obviously, modify the Y values with the real ones.
View attachment 1475193
I am not sure if it was clear from the other posts... Regarding a speaker with vertically aligned drivers and with all drivers on a common baffle (i.e. fixed z dimension):
If all drivers are measured with a single common mic position, and both vertical and horizontal polar scans were taken, then each driver should have 0,0,0 as driver coordinates. This is not how the VituixCad software was intended to be used, but it does work. All the requirements must be met (1) vertically aligned drivers, (2) common baffle, (3) fixed common mic position, and (4) polar scans in both vertical and horizontal planes.
Most of the time, the mic is raised/lowered to be on-axis with each driver. Most of the time, only horizontal polar scans are taken. Sometimes vertical polar scans are taken, but the mic position is on each driver's axis. This is more in keeping with Kimmo's instructions. In this more general case, it is necessary to install the driver's y dimension into the VituixCad simulation.
Driver position must somehow make it into the simulation. This can be done by explicitly entering the driver coordinates, or by having the positional information buried in the measured frequency/phase data. Depending on how the measurements are conducted, it is possible that some coordinates will need to be entered into the sim, while others are not. For example, it is fairly typical that only horizontal scans are taken, and each driver was measured on its own axis, and the distance from mic to baffle is kept constant. In this case, the y dimension is entered into VituixCad, but the x and z dimensions are left as 0.
j.
This is my case, so I will add -Y coordinate to mid and woofers.Most of the time, the mic is raised/lowered to be on-axis with each driver. Most of the time, only horizontal polar scans are taken.
Long post series coming. Gonna go over the optimizer tool. Mainly because it's fun.
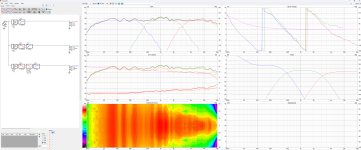
So I'm starting from here:
-Initial crossovers that we used before (LR4, 400hz/3000hz)
-Levels are set to get all the drivers in the ballpark
-I plugged in an LT and a highpass at 20hz to shape the bottom end.

Let's get the delay/phase squared away. Look at the 3khz area of the phase chart. The midrange phase line diverts from the tweeter, and delaying the midrange a little bit will fix that. On the left is original, the right is a 25us delay on the midrange. This is a minor correction. I'm going to leave everything else alone.


On to the optimizer!
Select the first option under the view tab.
You'll see this:

First I want to check my LT design, so select ref axis response of speaker (like the picture). Then we're going to adjust the textbook target and add a highpass. You can see I used a 2nd order highpass, and setup the same numbers that I used in my linkwitz transform for Qp and Fp.
Adjust the target SPL until the pink line matches the woofers response (ballpark middle of the ripples).


Now adjust the F0 and Q0 in the LT until your response matches the target curve.
Example, starting from very off numbers:


More in the next post
So I'm starting from here:
-Initial crossovers that we used before (LR4, 400hz/3000hz)
-Levels are set to get all the drivers in the ballpark
-I plugged in an LT and a highpass at 20hz to shape the bottom end.
Let's get the delay/phase squared away. Look at the 3khz area of the phase chart. The midrange phase line diverts from the tweeter, and delaying the midrange a little bit will fix that. On the left is original, the right is a 25us delay on the midrange. This is a minor correction. I'm going to leave everything else alone.
On to the optimizer!
Select the first option under the view tab.
You'll see this:
First I want to check my LT design, so select ref axis response of speaker (like the picture). Then we're going to adjust the textbook target and add a highpass. You can see I used a 2nd order highpass, and setup the same numbers that I used in my linkwitz transform for Qp and Fp.
Adjust the target SPL until the pink line matches the woofers response (ballpark middle of the ripples).
Now adjust the F0 and Q0 in the LT until your response matches the target curve.
Example, starting from very off numbers:
More in the next post
Attachments
- Home
- Loudspeakers
- Multi-Way
- 3-way to active - Hypex FA253 - learning project