I've modified my Braun LS200 speakers. And I'm currently satisfied with the result--I'm happy with their new sound.
But, the graph is strange.
Here are the schematics of before and after modification.


And this is the 'simulated' result from simulation software--VituixCAD2.

Regarding the graph, the response above 5kHz or tweeter's range in the green circle is strange, IMHO. As can be seen, the summation (blue line) curve is lied under tweeter's response (red curve). I've never seen this phenomenon before. What does it mean? Is it good, bad, or acceptable? Could anyone explain it?
However, as mentioned earlier, I'm happy with the current sound. So, if it's not recommended to change or avoid it, I would leave and live with it.
But, the graph is strange.
Here are the schematics of before and after modification.
And this is the 'simulated' result from simulation software--VituixCAD2.
Regarding the graph, the response above 5kHz or tweeter's range in the green circle is strange, IMHO. As can be seen, the summation (blue line) curve is lied under tweeter's response (red curve). I've never seen this phenomenon before. What does it mean? Is it good, bad, or acceptable? Could anyone explain it?
However, as mentioned earlier, I'm happy with the current sound. So, if it's not recommended to change or avoid it, I would leave and live with it.
What this shows is a filter phase response difference of greater than 90 degrees. Unfortunately, without combining the other response affecting factors (such as the driver responses) it isn't clear actually how much phase difference there is.

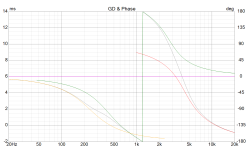
how much phase difference
These are plots of GD & Phase. Are they sufficient for analyzing? Please educate me as well.
Attachments
You are lacking phase summation.. I've never seen this phenomenon before.
Are you sure you adjusted for acoustical center offset?
You are lacking phase summation.
I'm not sure if post #3 is related to phase summation you talked about.
We can not analyse the system, but we can see that when the phase separates beyond 90 degrees as it does just below 5kHz, the responses stop summing and they subtract.Are they sufficient for analyzing?
This may not happen to the speaker because we don't know where phase is for the system.. but if it is beyond 90 degrees, this will happen.
double woofers, dome mid and tweeter on a flat baffle.
all offsets are set to 0.
you can expect anomalies in your sim from that, because that is not reality in the physical world.
IF you move the acoustic center offset in your simulation and you will see it change. (X, Y,Z are all at 0)
See the vituix manual for better explanations.
The woofers voice coil sits deeper then the tweeter.
You also added a 15,4 mf Cap, that will affect the phase relationship.
The added summed picture from Vituix is just for one of the XO versions?
The other one will have a different phase relationship, as it does not have a extra cap in the circuit.
I'm not sure if post #3 is related to phase summation you talked about.
- Home
- Loudspeakers
- Multi-Way
- Weird response but satisfied result