bimo - Agreed. My amplifier would rank in the top quartile if the simulation is accurate. The distortion is easy to analyze because it is dominated by the class AB output stage (by design). The number may be off by a factor of two but probably not by a factor of ten.
Ed
Ed
Another factor at play is the scarcity of real measurements on this forum. Lots of nice looking simulation numbers, but what about the real numbers for the actual build? I remember seeing one thread where the simulation showed 0.0003 %, but after the build, it measured 0.003%, an order of magnitude difference.

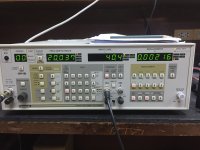
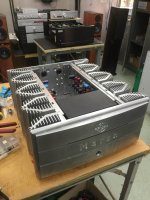
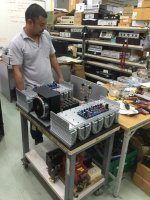
This is the measurement of my 200W CFA (it was built in Thailand).
Attachments
Last edited:
I like power amplifiers that have high slew rate, high damping factor AND anti-clip circuitry.
So long as THD @ near full power is below .05% I'm more than happy.
I think square wave performance is actually more informative than a fixed 20Khz sine wave signal 🙂
So long as THD @ near full power is below .05% I'm more than happy.
I think square wave performance is actually more informative than a fixed 20Khz sine wave signal 🙂
The huge different from implementation and simulation can be:Another factor at play is the scarcity of real measurements on this forum. Lots of nice looking simulation numbers, but what about the real numbers for the actual build? I remember seeing one thread where the simulation showed 0.0003 %, but after the build, it measured 0.003%, an order of magnitude difference.
1. The model in simulation is not accurate.
2. Bad implementation, like bad layout PCB, bad cable management, bad solder joint, etc.
3. Bad components.
One of my simulation, built and measured by someone here, and the result is similar with my simulation.
Those numbers are very low.I remember seeing one thread where the simulation showed 0.0003 %, but after the build, it measured 0.003%, an order of magnitude difference.
0.03% THD is easy - start with 1% THD open-loop and apply 30dB of negative feedback. Yet this is the top third of the commercial amplifiers.
I am skeptical of simulated THD much below 0.01%.
Ed
That's me too.I am skeptical of simulated THD much below 0.01%.
Ed
I'm primarily interested in the THD (+N) curve as a function of P and f - in other words, in the classic, old-school way.
In addition, the residual, the spectrum and the method of determination.
Personally, I always compare it with the ancient amplifiers A78 (Revox) and the CV121 (Dual) by measuring and listening ... or / but not only. The impressions I get are amazing and always grounding.
Greetings,
HBt.
I regard the THD as what it is, namely just an additional, final quality factor - something to compare with each other. A kind of stamp, along the lines of the product meets a standard and has passed QM, it's OK.
Personally, I test in all
I personally test with the most diverse time signals (the best known are the triangle and the rectangle, the most harmless is the sine/cosine - as we all know), sawtooth, pulses, burst, etc.pp.
So I look at the behavior of the DUT under different load and level conditions, of course with different frequencies and levels.
With this method, you can very quickly find all the flaws in a design. In the end, I rarely register THD+N significantly better than 0.03%.
HBt.
(I had forgotten that I also always compare it with the HiFi classic 3020i (NAD) ..!)
IIRC Stereophile measures with an AP, and engage the 20kHz low pass measurement filter.(*) THD+N decreases at 20KHz likely due to the output inductor.
[/code]
Ed
That automagically leads to dropping distortion (and response) near 20kHz.
Jan
This is a very important point, because the dynamic (frequency-dependent) output impedance of our amplifier plays a huge role in good sound from the point of view of the ideal voltage source.I like power amplifiers that have high slew rate, high damping factor (...)
I remember an old publication on DF from JBL I think. According to this, from DF > 30 the absolute value no longer plays any role.
🤔
you could add:why simulation may be optimistic:
- simulations use simplified component models
- simulations (usually) don't include pcb influence
- (Edit) simulations often use ideal power supplies
Oh, I had already suspected that, but I don't want to open this barrel any further - thank you Jan for this information.IIRC Stereophile measures with an AP, and engage the 20kHz low pass measurement filter.
That automagically leads to dropping distortion (and response) near 20kHz.
Jan
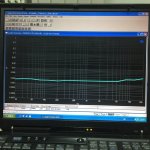
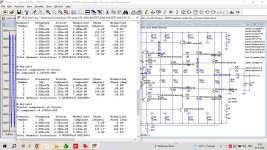
Here is simulated result at the same 20kHz and 40V as in the measured THD post #24, and it is only 4 to 5 times better. So I trast simulation very much when used good semicounductor models and good layout.Those numbers are very low.
0.03% THD is easy - start with 1% THD open-loop and apply 30dB of negative feedback. Yet this is the top third of the commercial amplifiers.
I am skeptical of simulated THD much below 0.01%.
Ed
Attachments
Last edited:
Your skepticism threshold is set way too high. Available free simulators and models are very good, or extremely good for the money. 🙂I am skeptical of simulated THD much below 0.01%.
I would set threshold at 0.000x% value. As bimo nailed it, difference between simulation and real circuit is mostly in the mistakes made during design and execution of the real thing. In example, a single wrong decision in PCB design can result with 20 dB worse distortion at 0.0000x% distortion levels.
I can offer comparison of latest amplifier that I’ve built and have extensively measured. Simulation predicted 0.00004% at 1W/8R. Measured result is 0.00007 – 0.00009 %, depending on channel sample and position of the moon and stars.
Harmonics distribution is similar to the simulation results as well. Simulated noise and power bandwidth are spot on.
My experience is that simulations are very useful if you learned how to put together good enough model.
@dadod
Do you have the operating instructions /user manual for the fantastic Panasonic analyzer to hand?
#
I love this antique measuring technology and am curious to see what the manual contains.
##
You have both measured around 0.003% and simulated 0.0006% - is that correct in terms of magnitude?
f=20kHz
P=50W(rms)
kindly,
HBt.
Please do this, perhaps in a separate thread, so that you /we can keep an overview - how did you achieve this?I can offer comparison of latest amplifier (...)
That is impressive.
THX
🙂
Not impressive, just very good, as numbers are for 1W and 1 kHz.
https://www.diyaudio.com/community/...te-low-power-class-a-amplifier-my-way.404147/
https://www.diyaudio.com/community/...te-low-power-class-a-amplifier-my-way.404147/
I also think this number is conservative. For my class A amplifiers, the distortion for most of them are below this value for 1W/8 ohms, both for simulations and real measuring values. I normally don't design my amplifiers to have low distortion as a first goal (so an output inductor is not necessary).I am skeptical of simulated THD much below 0.01%.
- Home
- Amplifiers
- Solid State
- Distortion in commercial amplifiers