Tomorrow I will test the amp without 390pF branch and will notify you about the results. I was also worried about make the situation getting worse and removed for the time being the shelf filter. Sorry my generator goes down only to Hz.It may be worthwhile removing the 390pF feedback cap to check squarewave response without that compensation assistance. Also worthwhile stating the load test conditions for any enclosed photo.
A good appreciation of LF response would need assessment below 10Hz. Hopefully the 220nF - 22nF//1M shelf networks, and the various feedback related LF roll-offs have done the job, although a frequency response curve would now indicate where phase and gain change is encroaching on the audio range.
The filter 390pF forms the HF dominate pole for the amp. If you remove it you likely to get instability 50KHz-100KHz with the NFB present but try it into a dummy 8R.
Another reference that can help in determining stability performance is Crowhurst's April 1957 article in Audiocraft https://worldradiohistory.com/Archive-All-Audio/Archive-Audiocraft/Audiocraft-1957-04.pdf. The technique that may be useful, given your oscillator can only go down to 10Hz, is to increase the feedback level (by lowering your feedback resistance), and identify when instability starts. The difficulty for you is that you don't now have a simple feedback circuit to then modify, and that testing for LF stability may require temporary roll-off of HF to avoid that aspect.
That Crowhurst article also raises the topic of how a zobel network can avoid your speaker setup from possibly causing HF instability that you may not have tested for.
That Crowhurst article also raises the topic of how a zobel network can avoid your speaker setup from possibly causing HF instability that you may not have tested for.
1. Please find enclosed three photos showing the impact of C15 capacity on the YT plots. Input signal = input of the first stage. Output signal measurements on 4Ohm resistors at the 4Ohm output of OPT.It may be worthwhile removing the 390pF feedback cap to check squarewave response without that compensation assistance. Also worthwhile stating the load test conditions for any enclosed photo.
A good appreciation of LF response would need assessment below 10Hz. Hopefully the 220nF - 22nF//1M shelf networks, and the various feedback related LF roll-offs have done the job, although a frequency response curve would now indicate where phase and gain change is encroaching on the audio range.
2. I'trying to have at home a better generator with 1Hz range or lower.
Best greetings, Jarek
Attachments
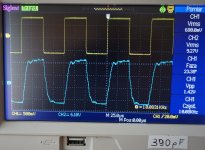
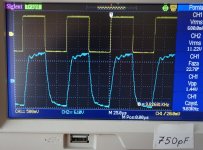
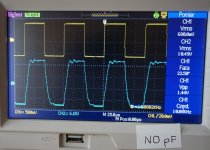
Jarek, one interesting item is that the squarewave response does not show a symmetrical response (ie. ringing on the bottom edge). That may be due to your output transformer, or something else may not be quite right (as the waveform should be symmetric).
Also the 'no pf' plot imho shows acceptable ringing on the top edge, and I'd even say the 390pF plot is worse with a resistive load. The character of the ringing, and stability margin, may show itself more with either increased feedback or no load.
Also the 'no pf' plot imho shows acceptable ringing on the top edge, and I'd even say the 390pF plot is worse with a resistive load. The character of the ringing, and stability margin, may show itself more with either increased feedback or no load.
<trobbins
I'd suggest you use the 1V/div LF plot drive level and do some X-Y plots with no feedback at say 10Hz, 20Hz, 50Hz to indicate the phase shift at LF>
Now I have at my disposal better arbitrary audio generator with lower ranges such as mHz, uHz and I can go beck to mentioned tests but first I want ask about some preconditions of the tests:
Is it correct?
Jarek
I'd suggest you use the 1V/div LF plot drive level and do some X-Y plots with no feedback at say 10Hz, 20Hz, 50Hz to indicate the phase shift at LF>
Now I have at my disposal better arbitrary audio generator with lower ranges such as mHz, uHz and I can go beck to mentioned tests but first I want ask about some preconditions of the tests:
- Is it necessary to replace T-NF terminals and replace them by R-C parallel connection, also resolder disconnected etrolitic capacitor C44=68uF? These improvements help me get rid of 1Hz resonance.
- Am I to use Zobel networks during these experiments or wait with them for the future? Morgan Jones claims that Zobel's values should be choosen with real loudspeakers.
Is it correct?
Jarek
I'm not sure what 'T-NF terminals' relates to? I can only identify 'C44' as a capacitor in parallel with a rectifier diode in your schematics (?)
A zobel network would be appropriate to use when testing with a simple speaker driver, and yes the zobel corner frequency should preferably be aligned with the speaker rising impedance with frequency, and should aim to make the amplifier output see a constant impedance equal to the speaker nominal impedance value (eg. 8 ohm) as frequency rises. The zobel network should not be used for amp testing that is using a fixed load resistor, or for testing onerous loads like open-circuit or capacitor only.
Imho, the important test result for LF response is when the phase =90deg, and =180 deg with no feedback. That means adjusting the frequency until the X-Y plot shows a 90 deg and a 180 deg response, and noting those frequency values. Making measurements at other fixed frequencies has no benefit for assessment unless quirky phase responses are seen such as when phase goes through an up/down/up type zone between say 90 and 180 deg. Note that the X-Y waveform can become quite distorted at such low frequencies, so determining 180 deg may be difficult and you may only be able to identify a frequency range where it looks like 180 deg is shown.
T terminal is a three terminal C-R circuit used in Global NFB with a middle tap to the ground - (R46,R47, R48,C46) on the schematic.
<trobbins, baudouin0>
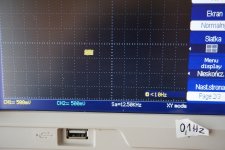
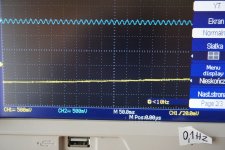
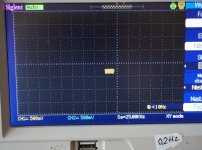
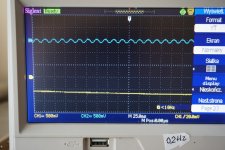
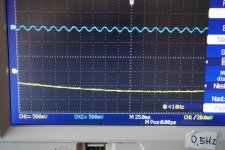
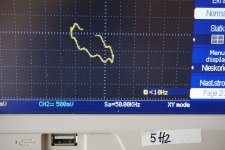
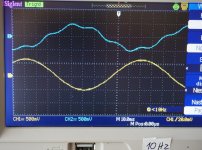
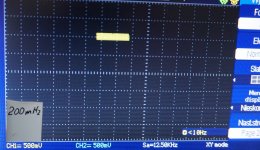
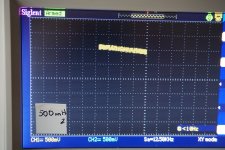
I'm sending some XY and YT plots I received at low frequencies of newly build Mullard amplifier. I hope they will help to straighten some issues connected with its performance. The shapes of them are looking very strange for me.
Remarks: Global NFB connection disconnected. On output OPT signal I see ripples of 50Hz. XY signal for 0,1Hz is jumping on the scope display.
Jarek
Attachments
-
 0,1Hz_XY_comp.jpg253.5 KB · Views: 75
 -
 0,1Hz_YT_comp.jpg874.6 KB · Views: 82
 -
 0,2Hz_XY_comp.jpg313.8 KB · Views: 83
 -
 0,2Hz_YT_comp.jpg280.6 KB · Views: 81
 -
 0,5Hz_XY_comp.jpg257 KB · Views: 74
 -
 0,5Hz_YT_comp.jpg301.6 KB · Views: 78
 -
 1HZ_XT_comp.jpg303.3 KB · Views: 73
 -
 1Hz_XY_comp.jpg275.6 KB · Views: 71
 -
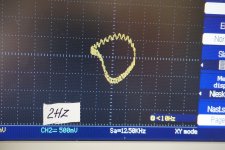
 2Hz_XY_comp.jpg275.8 KB · Views: 57
 -
 2Hz_YT_comp.jpg266.4 KB · Views: 63
 -
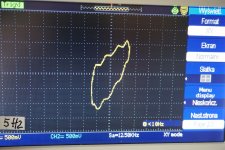
 5Hz_XY_comp.jpg271.1 KB · Views: 57
 -
 5Hz_YT_comp.jpg278.3 KB · Views: 54
 -
 10Hz_XY_comp.jpg272.9 KB · Views: 70
 -
 10Hz_YT_comp.jpg325.4 KB · Views: 76
I'd suggest re-reading post #508, as those latest photos don't provide any further stability related insight imho.
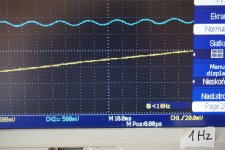
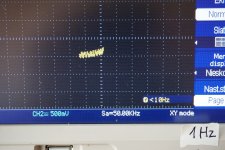
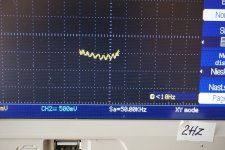
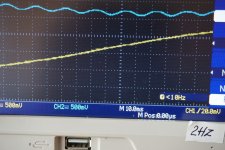
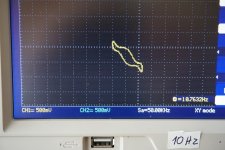
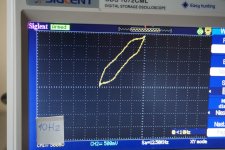
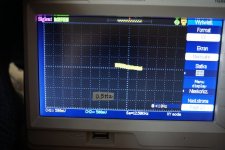
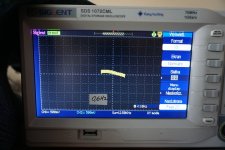
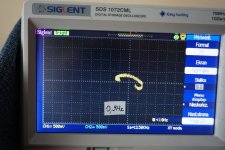
I started from 10Hz to align the amplitude of input and output signals from the amplifier for 10Hz. Then I looked for the plot on the scope similar to bookish one for 90deg phase shift. The most similar seemed to be signals of 1.800 Hz (see the photo). Then I adjust lower frequencies of 0.500Hz and 0.200Hz (see the photos). Below 0.200 Hz the line on the scope started to jump in horizontal direction.I'd suggest re-reading post #508, as those latest photos don't provide any further stability related insight imho.
Attachments
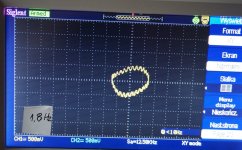
Yes it can be difficult to get a clean X-Y waveform indication. The 1.8Hz 'circle/ellipse' appears to be close to a 90 deg shift. Does the phase shift appear to progress monotonically from 0 deg to 90 deg as frequency is reduced from mid-band to 1.8Hz, or are there 'flat spots' where phase doesn't change much, or actually changes back towards 0 deg for a bit? The same query would also be valid as frequency reduced below 1.8Hz, and phase shift progressed towards 180 deg.
Why are these XY plots different from that shown in post #510 for 10Hz and 1 or 2Hz ?
Why are these XY plots different from that shown in post #510 for 10Hz and 1 or 2Hz ?
With reference to schematic #481 (simple C46=470p || R46=3k3 feedback). You can make a major improvement to LF stability by replacing C14 2200uF with 220uF (your notation). I would also suggest adding input DC blocking cap (220n not 1uF as shown in LTspice).
.png")
.png")
Last edited:
<trobbins>
Why are these XY plots different from that shown in post #510 for 10Hz and 1 or 2Hz ?
1. Plots are done with lower input amplitude to say 400-500mVRMS.
2. To get a circle plot for 90DEG i was playing with amplitudes of signals (with poor results).
3. I did invertion of one signal at the scope to have XY drawings just like in the books.
Tomorrow I will do next practical tests as you suggest.
<baudouin0>
Thanks you for the simulation in spice program.
Is replacing of previously used MosFET voltage regulator for 140V with R-DZener a permanent change or I it is better to return to previous circuit?
<trobbins
Yes it can be difficult to get a clean X-Y waveform indication. The 1.8Hz 'circle/ellipse' appears to be close to a 90 deg shift. Does the phase shift appear to progress monotonically from 0 deg to 90 deg as frequency is reduced from mid-band to 1.8Hz, or are there 'flat spots' where phase doesn't change much, or actually changes back towards 0 deg for a bit? The same query would also be valid as frequency reduced below 1.8Hz, and phase shift progressed towards 180 deg.>
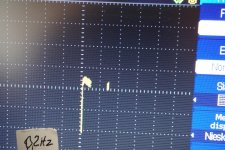
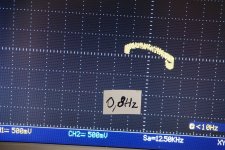
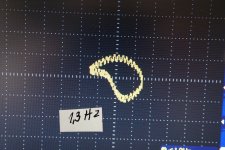
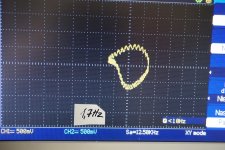
I listed some photoes of the screen in the XY mode. They were done when with the frequency going down from 5Hz-0.7Hz. The change of the plot was monotonous.
The situation was different in the range 0.5-0.2Hz where the changing the frequency cause changing of the shape of the XY plot on the screen. Sometimes the the plot was linear but sometimes not. I was going up and down with the frequency - and the phenomenon appeared at different (by 0,1-0,2 Hz) frequencies .
Yes it can be difficult to get a clean X-Y waveform indication. The 1.8Hz 'circle/ellipse' appears to be close to a 90 deg shift. Does the phase shift appear to progress monotonically from 0 deg to 90 deg as frequency is reduced from mid-band to 1.8Hz, or are there 'flat spots' where phase doesn't change much, or actually changes back towards 0 deg for a bit? The same query would also be valid as frequency reduced below 1.8Hz, and phase shift progressed towards 180 deg.>
I listed some photoes of the screen in the XY mode. They were done when with the frequency going down from 5Hz-0.7Hz. The change of the plot was monotonous.
The situation was different in the range 0.5-0.2Hz where the changing the frequency cause changing of the shape of the XY plot on the screen. Sometimes the the plot was linear but sometimes not. I was going up and down with the frequency - and the phenomenon appeared at different (by 0,1-0,2 Hz) frequencies .
Attachments
-
 Appr_0,2Hz_XY_08.04.22_comp.jpg273.9 KB · Views: 58
 -
 Appr_0,5Hz_XY_08.04.22comp.jpg225.5 KB · Views: 59
 -
 Appr_0,6Hz_XY_08.04.22_comp.jpg237.1 KB · Views: 59
 -
 Appr_0,8Hz_XY_08.04.22_comp.jpg349.9 KB · Views: 54
 -
 Appr_0,9Hz_XY_08.04.22_comp.jpg270.1 KB · Views: 56
 -
 Appr_1,1Hz_XY_08.04.22_comp.jpg275 KB · Views: 61
 -
 Appr_1,3Hz_XY_08.04.22_comp.jpg291.6 KB · Views: 53
 -
 Appr_1,7Hz_XY_08.04.22_comp.jpg321.7 KB · Views: 55
 -
 Appr_2,0Hz_XY_08.04.22_comp.jpg268.5 KB · Views: 60
 -
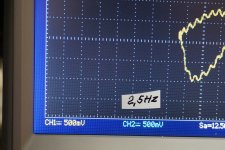 Appr_2,5Hz_XY_08.04.22_comp.jpg294.4 KB · Views: 54
 -
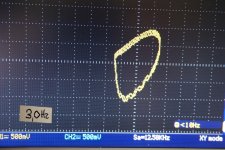 Appr_3Hz_XY_08.04.22_comp.jpg309.6 KB · Views: 58
 -
 Appr_5Hz_XY_08.04.22_comp.jpg321.9 KB · Views: 58
Well done for working through that.
I think one reason the X-Y plot is not shaped more like a circle/ellipse is related to why your squarewave response was not symmetric. You seem to have a gain or non-linear difference between each side of the balanced circuit paths. Perhaps best to probe through your circuit stages (with no feedback). The signal waveforms at the PI stage (eg. at V4/1 input grid and V4/2 input grid) should be the same magnitude but opposite phase, and with no distortion for a sinewave input.
I think one reason the X-Y plot is not shaped more like a circle/ellipse is related to why your squarewave response was not symmetric. You seem to have a gain or non-linear difference between each side of the balanced circuit paths. Perhaps best to probe through your circuit stages (with no feedback). The signal waveforms at the PI stage (eg. at V4/1 input grid and V4/2 input grid) should be the same magnitude but opposite phase, and with no distortion for a sinewave input.
I reorganized the schematic according to your suggestion introducing C46=470p || R46=3k3 in GNFB. Also replaced C14=2200uF for 220uF. The result was motor boating again! Tomorrow I will be back at the old schematic with T terminal to continue experiments.With reference to schematic #481 (simple C46=470p || R46=3k3 feedback). You can make a major improvement to LF stability by replacing C14 2200uF with 220uF (your notation). I would also suggest adding input DC blocking cap (220n not 1uF as shown in LTspice)
Can you explain to me what for is the shunting resistor R17=10k? Is input capacitor C10=220nF really necessary?
Jarek
- Home
- Amplifiers
- Tubes / Valves
- Testing newly built mullard 5-20