I’m curious why system phase changes when both drivers in a 2-way are inverted? The response remains identical but the phase changes. I have not measured this in real life, just xsim.
Member
Joined 2003
Even though both drivers are inverted, their relative phase difference is the same.
However, system phase (relative to the input/reference) is different.
Dave.
However, system phase (relative to the input/reference) is different.
Dave.
Thanks. I see now that the phase is identical, but shifted 180 degrees. The point where it crosses the 180 degree point has moved though. Would there be any reason to invert both drivers? Does that point where it crosses 180 matter? This 2 way crosses at 1.1k. Non-inverted has the vertical line at 1.9k, while the inverted is at 500hz. Or does the location of that vertical line not matter? I'm trying to imagine this phase in 3D. I have a feeling this flat representation is like looking at a world map all flattened out.

Naturally left and right need to be the same.. however changing both can be a way to manipulate harmonic distortion.Would there be any reason to invert both drivers?
No.Does that point where it crosses 180 matter?
.....
does the location of that vertical line not matter?
How's that work?? 🙂......however changing both can be a way to manipulate harmonic distortion.
Dave.
The vertical lines come from the way the phase is plotted. It is plotted between +- 180°. So if the total phaseshift exeeds 180° the plot is continued on the opposite side. The vertical line is only there to make the plot easier to read.Thanks. I see now that the phase is identical, but shifted 180 degrees. The point where it crosses the 180 degree point has moved though. Would there be any reason to invert both drivers? Does that point where it crosses 180 matter? This 2 way crosses at 1.1k. Non-inverted has the vertical line at 1.9k, while the inverted is at 500hz. Or does the location of that vertical line not matter? I'm trying to imagine this phase in 3D. I have a feeling this flat representation is like looking at a world map all flattened out.
View attachment 1029715
And as the phase is shifted by -180° after the polarity change it simply crosses the plots -180° y-boundary sooner.
Thanks. I see now that the phase is identical, but shifted 180 degrees. The point where it crosses the 180 degree point has moved though. Would there be any reason to invert both drivers? Does that point where it crosses 180 matter? This 2 way crosses at 1.1k. Non-inverted has the vertical line at 1.9k, while the inverted is at 500hz. Or does the location of that vertical line not matter? I'm trying to imagine this phase in 3D. I have a feeling this flat representation is like looking at a world map all flattened out.
View attachment 1029715
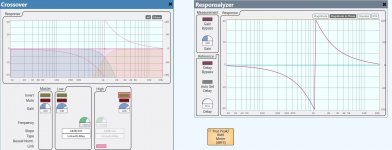
The reason the vertical line shifts is because of where the software sets phase at 20kHz.
If the software set phase at at 20Khz to zero degrees for non-inverted, the vertical line would be at xover freq of 1100Hz
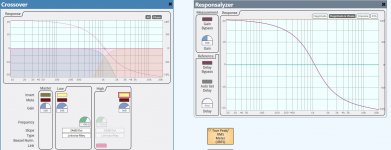
Like this: (and assuming a LR24)

The Responsaylzer screen on the right is a measured response like REW would give, of the crossover shown.
With both channels inverted, a measurement will show 20kHz phase to move to -180 degrees.
Notice phase is now zero degrees at xover freq of 1100Hz.

So it's just a matter of where phase is set at the upper end of response, and how the 360 degrees of rotation stems from that setting.
Notice that on your graph, the two phase traces are separated by 180 degrees at 20kHz (60 deg & -120deg.)
" I have a feeling this flat representation is like looking at a world map all flattened out."
I like that description....me too !!!
Now you're introducing another variable. I suggest to stay focused.@Davey, by playing the amp off against the speaker. Depending on the polarity of the distortion component they'll either add or subtract.
You might have newbies reading these threads and when you post stuff like that (without context) it doesn't pass the common sense smell test. (Actually, it doesn't pass the smell test with context.)
In any case, I could simply reverse the main speaker wire polarity and I'd be back to square one again.
Dave.
- Home
- Loudspeakers
- Multi-Way
- Phase changes in xsim when inverting both drivers?