Kudos to the folks at SynAudCon for recently making this video available to the public. And to its founder Don Davis for making it in the first place in 1979. Don was the sole voice promoting and teaching Richard Heyser's Time Delay Spectrometry, which had lain dormant for 10 years after it was introduced.
https://www.prosoundtraining.com/2021/02/04/heyser-videos/
Many folks are unaware of Dick's genius, and his huge influence on measurement and evaluation of loudspeakers and acoustics. I consider his AES papers essential reading. But there is no better way to get a feel for the man than to watch this video.
This was Dick's first public presentation of TDS, using surplus equipment that he modified, and some he built himself. The FFT analyzers used were loaners. A couple bugs had not yet been worked out of the system. As a result, the presentation bogs down in a couple of places while they're being tracked down. It might have been better if they just edited those out. I attended his first formal TDS class in 1981, and it all went much smoother.
Enjoy.
🙂I consider his AES papers essential reading.
https://www.aes.org/technical/documents/openaccess/AES_TimeDelaySpectrometry.pdf
https://www.freepatentsonline.com/3466652.pdf
https://www.freepatentsonline.com/4279019.pdf
George
Last edited:
Thanx for the video. It is sad that this techique has languished. It seems to have many upsides.which had lain dormant for 10 years after it was introduced.
Supposedly i own a B&K TDS box, but it is sitting in Calgary.
Worth repeating. I wish, given the computer graphics we now have, that impedance was shown in a rotatable 3D “Heyser” graph.Many folks are unaware of Dick's genius, and his huge influence on measurement and evaluation of loudspeakers and acoustics.
dave
More expensive to implement than a simple soundcard.Thanx for the video. It is sad that this techique has languished. It seems to have many upsides.
Nice. That was the expensive path into TDS 🙂Supposedly i own a B&K TDS box, but it is sitting in Calgary.
Worth repeating. I wish, given the computer graphics we now have, that impedance was shown in a rotatable 3D “Heyser” graph.
Care to elaborate why?
I learned something from this video that hadn't sunk in previously. One use of the Nyquist presentation is when dialing into the removal of airpath delay. For a minimum-phase system, everything will be in the right half-plane when it is correct. More intuitive than correlating the slopes, and deflection minima/maxima with midpoints in mag/phase plots...
TGS should be fairly easy with modern computers. The TDS box is intended as a partial return on a huge loan i tendered to a friend (who has mostly defaulted, if this is all i ever get it will be a very pricey piece of kit,
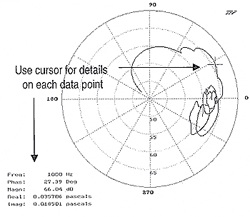
The 3D impedance plot can be rotated to emualte the 2 graphs we typically get and the 3rd (see below) rarely seen since the days of “Audio", and i fell does a better job of letting you see the relation between magnitude & phase. It would lead to a greater grooling of the impedance curve. It is not 3 curves it is 3 views of te same curve.

dave
The 3D impedance plot can be rotated to emualte the 2 graphs we typically get and the 3rd (see below) rarely seen since the days of “Audio", and i fell does a better job of letting you see the relation between magnitude & phase. It would lead to a greater grooling of the impedance curve. It is not 3 curves it is 3 views of te same curve.
dave

With modern computers, yes. But not with integrated ADC/DAC chips, which AFAIK have no provision for programmable delay of the ADC relative to the DAC.TGS should be fairly easy with modern computers.
The TDS box is intended as a partial return on a huge loan i tendered to a friend (who has mostly defaulted, if this is all i ever get it will be a very pricey piece of kit,
Ouch. Sorry to hear it.
The 3D impedance plot can be rotated to emualte the 2 graphs we typically get and the 3rd (see below) rarely seen since the days of “Audio", and i fell does a better job of letting you see the relation between magnitude & phase. It would lead to a greater grooling of the impedance curve. It is not 3 curves it is 3 views of te same curve.
dave
OK, yes, I got that. With a cursor and digital readout, Nyquist plots are pretty usable. But still, it's definitely an uphilll battle to ask most users to give up Frequency being on the horizontal axis for just about anything except a scope display! 🙂
- Home
- General Interest
- Everything Else
- Video of Richard Heyser's first public TDS demo