Updates to this project 21/09/21
Thanks to @augerpro,
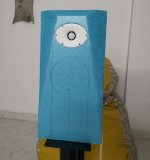
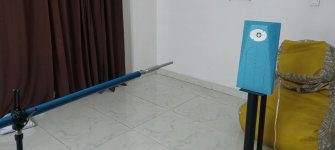
I have made a temporary baffle (or half its size height-wise (about 50cm high)), attached the tweeter to the waveguide and started studying taking on and off axis measurements with REW and a dayton EMM-6 MIC with ESI U86XT soundcard. Here are some pics of baffle, measurements and resulting frequency response measurements, over 50 degree angle (0 to 50 degree or 10 to 60 degree, I lost one of the measurements, not sure which one).
I made the baffle out of insulation foam material and carved the angular shapes/chamfers on the baffle out of it using pen knifes. The dimensions are similar to the intended final widths and final look of the baffle (at least the top half of it).
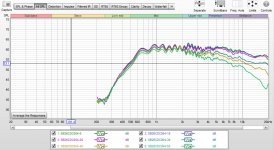
The measurements look a little corrupted due to reflections from somewhere. Need to figure it out. However, as of now, I am very happy with this preliminary attempt where I have been able to capture the horizontal off axis behavior of a waveguide to some extent. We can see the frequency response curves clearly separating out as the off axis angles increase and there is no bunching of curves at higher frequencies, which is one of the intended behaviors with a waveguide
Now, I am having some confidence with more measurements and finalizing box shape for building it. Next steps is to refine the measurement setup like pillows on the floor, making the transition from mic to pvc pipe seamless, better positioning of overall setup, etc etc... and bringing in VituixCAD into the workflow.
🙂
Thanks
Thanks to @augerpro,
I have made a temporary baffle (or half its size height-wise (about 50cm high)), attached the tweeter to the waveguide and started studying taking on and off axis measurements with REW and a dayton EMM-6 MIC with ESI U86XT soundcard. Here are some pics of baffle, measurements and resulting frequency response measurements, over 50 degree angle (0 to 50 degree or 10 to 60 degree, I lost one of the measurements, not sure which one).
I made the baffle out of insulation foam material and carved the angular shapes/chamfers on the baffle out of it using pen knifes. The dimensions are similar to the intended final widths and final look of the baffle (at least the top half of it).
The measurements look a little corrupted due to reflections from somewhere. Need to figure it out. However, as of now, I am very happy with this preliminary attempt where I have been able to capture the horizontal off axis behavior of a waveguide to some extent. We can see the frequency response curves clearly separating out as the off axis angles increase and there is no bunching of curves at higher frequencies, which is one of the intended behaviors with a waveguide
Now, I am having some confidence with more measurements and finalizing box shape for building it. Next steps is to refine the measurement setup like pillows on the floor, making the transition from mic to pvc pipe seamless, better positioning of overall setup, etc etc... and bringing in VituixCAD into the workflow.
🙂
Thanks
Attachments
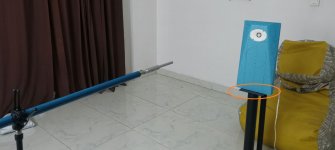
I circled the most likely source of the reflections in your measurement.
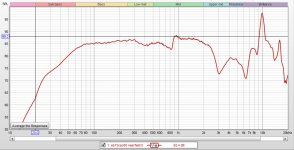
Thanks a lot. I think it could also have come from some other reflection. Need to study the impulse respinse plot for reflection. When I applied a 4ms gate instead of earlier 5 ms, this is what I get.
Thanks
Attachments
Question regarding center-to-center distance between mid and tweeter
Hi All,
I have a question regarding what should be the center-to-center spacing between the mid and tweeter in my setup with the waveguided tweeter. I have seen two types of opinions about this as given below.
1) It is often said that the mid and tweeter should be positioned as with close c2c distance as possible, ideally within 1/4th of the wavelength for crossover to make the vertical directivity of the overall system good. This is possible between mid and woofer due to lower crossover point but seems very difficult between mid and tweeter if a high crossover is intended.
2) I have seen in VituixCAD threads that the c2c between the drivers should be about 1.2x the wavelength of crossover frequency for getting a good power response.
Could anyone elaborate more on this and explain to me the pros and cons of both approaches above ?
Thanks
Hi,
yes it is not possible to get 1/4wl spacing on the short wavelengths.
My interpretation of the kimmosto c-c rule of thumb is that it has a context and might not always apply. He is referencing a typical bookshelf 2 way box and the take away there is that it is better to have bigger c-c than as small as possible. All this can be easily seen and tested in VituixCAD. Anyone can get very good results with VituixCAD without actually generalizing the aspects that make a good (or bad) response. Kimmosto can pull this kind of rules of thumbs and generalizations out of the simulations with his vast experience but you could have made a speaker what follows this "rule" by just tuning the xo until the response looks good. Of course you'd have to know what is good and what is bad and what is better than something else or is it important at all while tuning the xo parameters. This comes with experience but it is not too much work and of course reading what the more experienced have to say will help a lot.
Anyway, when c-c is ~>1/2wl the spacing affects where the inevitable nulls on vertical response happen (lobing). With increased c-c spacing the nulls become smaller and higher Q but they get quite near the 0 axis both above and below. With smaller spacing the nulls are less deep, cover more angles but not so close the 0. The increased spacing gives better early reflections graph and high Q dips aren't as audible as broad Q so I suppose this is better. I haven't done real world listening experiments on this but lets trust those who are 🙂 At least the graphs look smoother.
With a 3 way speaker the mid - tweet xo doesn't have to be as exact as with 2 way systems so you can build it and tune the xo frequency a bit without too much other problems (distortion) since the drivers are not operated in their absolute limits. Now, when you build and measure your speaker you just massage the xo frequency and slopes in the simulator for smoothest results. You don't have to mind about the exact frequencies and spacings and what not, the physical object is what it is and just use the mouse wheel to tune parameters to simulate the electronics side and see what happens. If the woofer or tweeter ends up sounding strained change the xo frequency, drivers or build another box with different physical dimensions and driver locations.
In the end the xo depends on the physical construct where the drivers are part of. You'll get better speaker with better physical construct, the xo just makes it all work in tandem and I don't see any reason xo being the limiting factor here. VituixCAD is such a good tool that with good measurements you can perfect the xo to the physical construct pretty easily. Verdict, only the physical construct that operate in the acoustic domain will limit the loudspeaker performance.
So, build and measure a prototype, tune the simulation and see if you can get good response or if the physical construction needs to be changed for better. I'd say build a quick prototype and don't mind about c-c too much yet, you can let it be rather big, or small, let other issues you are facing dictate the position. It is hard to get everything right first time before any measurements. Anyway, there probably is multiple points for improvement with a prototype besides the acoustic properties. Construction techniques and finishing and all kinds of great stuff is learned with prototyping. Have fun!🙂
Attached is a 3-way simulation of speaker that has minimal baffle and tweeter in waveguide. The GIF contains images that vary the c-c by changing mid driver Y-parameter. The xo frequency is about 2000Hz so I used 17cm as 1 wl. Varying the xo point while keeping the Y same would be more accurate demonstration, but very slow to make so here we go 😀 Watch the normalized polar map to see the lobing around 2kHz. Then see the power / DI graph above and observe the light red ERDI line smoothness. It is almost as smooth on the ~1-1.5wl as with 0.25wl, worst bump being when c-c between ~0.5 and 1wl. The orange inroom response graph is only relevant to the particular system and room settings the simulation had, forgot that visible. Predicted in room response is affected by ERDI by a great deal along with sound power and listening window response. I'm not too familiar all of this and pulling most of it from my memory so please do a fact check, thanks 🙂
Attachments
Last edited:
Hi,
yes it is not possible to get 1/4wl spacing on the short wavelengths.
My interpretation of the kimmosto c-c rule of thumb is that it has a context and might not always apply. He is referencing a typical bookshelf 2 way box and the take away there is that it is better to have bigger c-c than as small as possible. All this can be easily seen and tested in VituixCAD. Anyone can get very good results with VituixCAD without actually generalizing the aspects that make a good (or bad) response. Kimmosto can pull this kind of rules of thumbs and generalizations out of the simulations with his vast experience but you could have made a speaker what follows this "rule" by just tuning the xo until the response looks good. Of course you'd have to know what is good and what is bad and what is better than something else or is it important at all while tuning the xo parameters. This comes with experience but it is not too much work and of course reading what the more experienced have to say will help a lot.
Anyway, when c-c is ~>1/2wl the spacing affects where the inevitable nulls on vertical response happen (lobing). With increased c-c spacing the nulls become smaller and higher Q but they get quite near the 0 axis both above and below. With smaller spacing the nulls are less deep, cover more angles but not so close the 0. The increased spacing gives better early reflections graph and high Q dips aren't as audible as broad Q so I suppose this is better. I haven't done real world listening experiments on this but lets trust those who are 🙂 At least the graphs look smoother.
With a 3 way speaker the mid - tweet xo doesn't have to be as exact as with 2 way systems so you can build it and tune the xo frequency a bit without too much other problems (distortion) since the drivers are not operated in their absolute limits. Now, when you build and measure your speaker you just massage the xo frequency and slopes in the simulator for smoothest results. You don't have to mind about the exact frequencies and spacings and what not, the physical object is what it is and just use the mouse wheel to tune parameters to simulate the electronics side and see what happens. If the woofer or tweeter ends up sounding strained change the xo frequency, drivers or build another box with different physical dimensions and driver locations.
In the end the xo depends on the physical construct where the drivers are part of. You'll get better speaker with better physical construct, the xo just makes it all work in tandem and I don't see any reason xo being the limiting factor here. VituixCAD is such a good tool that with good measurements you can perfect the xo to the physical construct pretty easily. Verdict, only the physical construct that operate in the acoustic domain will limit the loudspeaker performance.
So, build and measure a prototype, tune the simulation and see if you can get good response or if the physical construction needs to be changed for better. I'd say build a quick prototype and don't mind about c-c too much yet, you can let it be rather big, or small, let other issues you are facing dictate the position. It is hard to get everything right first time before any measurements. Anyway, there probably is multiple points for improvement with a prototype besides the acoustic properties. Construction techniques and finishing and all kinds of great stuff is learned with prototyping. Have fun!🙂
Attached is a 3-way simulation of speaker that has minimal baffle and tweeter in waveguide. The GIF contains images that vary the c-c by changing mid driver Y-parameter. The xo frequency is about 2000Hz so I used 17cm as 1 wl. Varying the xo point while keeping the Y same would be more accurate demonstration, but very slow to make so here we go 😀 Watch the normalized polar map to see the lobing around 2kHz. Then see the power / DI graph above and observe the light red ERDI line smoothness. It is almost as smooth on the ~1-1.5wl as with 0.25wl, worst bump being when c-c between ~0.5 and 1wl. The orange inroom response graph is only relevant to the particular system and room settings the simulation had, forgot that visible. Predicted in room response is affected by ERDI by a great deal along with sound power and listening window response. I'm not too familiar all of this and pulling most of it from my memory so please do a fact check, thanks 🙂
This is an awesome post. Great deal of new information for me. I will explore the different aspects mentioned like box construction and crossover design in VituixCAD in more detail. Unfortunately, I don't have the flexibility or resources to build multiple prototype enclosures for this project using actual enclosure building materials. Even the final enclsoure build I have to entrust with friends who are experts at it. Maybe for now, I will experiment a bit more with the XPS foam material, making boxes out of it etc and see what it leads to wrt frequency responses and play with it in VituixCAD.
Thanks a lot.. 🙂🙂
If you cannot build a proto make a best guess of the xo frequency. When c-c can't be less than ~1/2wl I would avoid the 3/4wl c-c territory and position the drivers accordingly a bit further apart. Maybe hit 1.2wl with the intended xo frequency so there is some slack to adjust xo up or down after you get the measurements. I'm not sure what would be the best approach here, without prototyping. Prototyping is very effective way to get better performance. It is also good to keep in mind there could be many other design criteria that could trump this c-c optimization, so anything goes. It is always a bag of compromises to choose from.
You can try to approximate this c-c issue and other things with the manufacturer on-axis measurement data and VCAD diffraction simulator generated measurements. At least you can get some feel how much things change when you adjust the c-c spacing, xo, baffle size and shape and what not. Even if this is not exactly like the finished speaker acoustic output it should be in the ballpark. Playing with any "realistic" data in the simulator can be very educational.
You can try to approximate this c-c issue and other things with the manufacturer on-axis measurement data and VCAD diffraction simulator generated measurements. At least you can get some feel how much things change when you adjust the c-c spacing, xo, baffle size and shape and what not. Even if this is not exactly like the finished speaker acoustic output it should be in the ballpark. Playing with any "realistic" data in the simulator can be very educational.
Last edited:
Actually I had only traced a single on-axes curve for each diver. All the off axis responses were generated using VituixCAD diffraction tool. As you rightly said even if I had taken all the off axis plots and do the sims using them, they will still differ based on my actual implementation of drivers in the cabinet. Hence I am stopping playing around with these plots and focus on more important things for now like taking steps to finalize the bass alignment, and building the speaker cabinet.
As a last attempt, I played with the crossover for a little more and the results are shown in attached plots. Whether it is of any use in actual practice is doubtful due to the probably unreliable nature of the data itself but this seems like the best results I could achieve so far.
Thanks
Thanks again for your suggestions. In previous posts I have made in this thread, I had designed different versions of a prototype crossover using traced SPLs for this combination of drivers in combination with VituixCAD diffraction simulations and found that 165mm c2c spacing for a 2kHz crossover between the tweeter and mid gave some nice looking results in terms of horizontal and vertical directivities (nice only to my limited knowledge). I used it as a way to learn some aspects of vituixCAD. However, I stopped it after a point since even though it was good to play around with traced SPLs, most probably these nice looking results won't translate well into a real world prototype. I was also suggested to try waveguides and I tried procuring it as described in previous posts. I also made a prototype baffle as seen in above posts and am in the process of learning to do proper measurements. Sample measurements that I took yesterday are attached in the same previous posts. Next task is to take measurements from the mid driver & tweeter again in a better, refined measurement setup.
As you suggested, I will make a prototype box with 1.2x spacing between mid and tweeter for a 2-2.5 kHz crossover. In fact the prototype baffle which I attached in previous post for tweeter measurements is intended to be completed with a box around it. But I am limited to make it out of xps foam at the moment. From experiences stated by senior members here in other threads, hopefully it will make a good temporary prototyping material. I had tried it with small fullrange drivers like Peerless TC9FD18 shown in attached image but never with a multiway speaker prototype.
Thanks a lot again.. 🙂🙂
Attachments

I'm sorry I didn't read the whole thread before I posted, I should have 🙂
Good progress! Keep it going and you'll end up with tons of knowledge and most probably a pair of good sounding loudspeakers! At least you'll be able to constantly better the performance until happy. XPS/foam core have been used a lot by member XRK and others, it will be fine for prototyping I believe.
Using only baffle for measurements: I'd try adding the "whole box" to the mixture at some point. The edge of the baffle will diffract differently if the box is not there.
Have fun!🙂
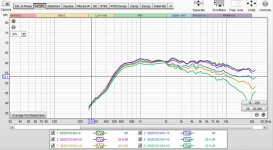
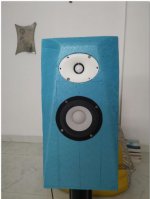
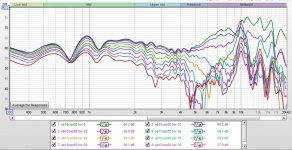
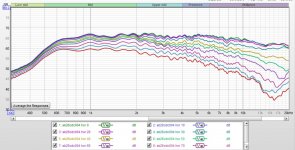
More driver measurements for mid and tweeter on baffle
I have finally completed a prototype box with the baffle attached to it. The box size for the mid is currently about 10 L in volume. Using this, I have tried to do full 0 to 90 degree measurements in the horizontal plane on for both the mid driver SB15CAC30-8 and the tweeter SB26CDC004 i 4 inch waveguide. Looks like they came out well. 🙂
The tweeter in the waveguide looks good 🙂
Now it is time to start thinking about building the actual enclosure.
In the meanwhile, I will use these measurements and VituixCAD to design a prototype crossover.
Pic-1 shows drivers on baffle
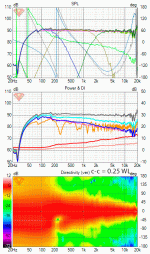
Pic-2 is the nearfield measurement of the mid
Pic-3 is the gated far field measurement set for mid (gate = 4ms)
Pic-4 is the gate far field measurement data for tweeter (gate = 4ms)
Thanks
Vineeth
I have finally completed a prototype box with the baffle attached to it. The box size for the mid is currently about 10 L in volume. Using this, I have tried to do full 0 to 90 degree measurements in the horizontal plane on for both the mid driver SB15CAC30-8 and the tweeter SB26CDC004 i 4 inch waveguide. Looks like they came out well. 🙂
The tweeter in the waveguide looks good 🙂
Now it is time to start thinking about building the actual enclosure.
In the meanwhile, I will use these measurements and VituixCAD to design a prototype crossover.
Pic-1 shows drivers on baffle
Pic-2 is the nearfield measurement of the mid
Pic-3 is the gated far field measurement set for mid (gate = 4ms)
Pic-4 is the gate far field measurement data for tweeter (gate = 4ms)
Thanks
Vineeth
Attachments
Can VituixCAd do polar plots? I would like to see those. My concern is that while the power response does smooth out again above 1.2wl, if you could see the actual lobing you might not be as impressed. My guess is that the single forward lobe that gets narrower as ctc goes up will at some point split into multiple very narrow lobes. Yes overall power response is smoother but what is the effect at the listening position if you aren't exactly on the design axis? If you stand up? Or move your head?
Augerpro, what you describe is in line with my observations. For higher driver separation (or higher crossover) the vertical dips further (70-90deg) from axial get filled and this fills power response dip at Fc and linearizes DI.
Last edited:
Can VituixCAd do polar plots? I would like to see those. My concern is that while the power response does smooth out again above 1.2wl, if you could see the actual lobing you might not be as impressed. My guess is that the single forward lobe that gets narrower as ctc goes up will at some point split into multiple very narrow lobes. Yes overall power response is smoother but what is the effect at the listening position if you aren't exactly on the design axis? If you stand up? Or move your head?
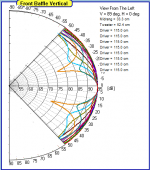
Hi are you describing the effects on vertical polar response as shown in the gif image attached in post number 48 on this thread. There I can see some splitting of vertica lobe into multiple smaller lobes etc..
Pic in post #53
Thre is still 5cm extra distance between mid and tweeter. It is always best to place them as close as possible, specifically when listening distance is short(ish). The cutouts for driver bodies will leave enough material in-between, despite flanges touch each other.
Visual aspect is another question, but you have a good match in that respect IMO!
And I would like to tilt tweeter's response a bit higher from 8kHz up. Perhaps just WG-effect compensation might have higher dB setting in dsp?
Last edited:
Augerpro, what you describe is in line with my observations. For higher driver separation (or higher crossover) the vertical dips further (70-90deg) from axial get filled and this fills power response dip at Fc and linearizes DI.
I remember your study with Vituix regarding driver spacing. If I understand correctly: 1.2 or 1.4 wavelenght is good for power response smoothness but not so good for vertical directivity (lobes mentioned by augerpro) where shorter driver spacing is better. But in the end, what is the most important ? Augerpro example where your head is in a nulls lobe for instance ? My intuition is that depend on listening distance ? In a big room at 3 meters from the speaker I would focus on power response and vice versa for short distance ?
Copied text from the CTA-2034-A standard where the basis for this c-c trick comes from.
Basis for Estimated In-Room Response Calculation
In theory, with complete 360-degree anechoic data on a loudspeaker and sufficient acoustical
and geometrical data on the listening room and its layout it would be possible to estimate with
good precision what would be measured by an omnidirectional microphone located in the
listening area of that room. By making some simplifying assumptions about the listening space,
the data set described above permits a usefully accurate preview of how a given loudspeaker
might perform in a typical domestic listening room. Obviously, there are no guarantees, because
individual rooms can be acoustically aberrant. Sometimes rooms are excessively reflective (“live”)
as happens in certain hot, humid climates, with certain styles of interior décor and in under-
furnished rooms. Sometimes rooms are excessively “dead” as in other styles of décor and in
some custom home theaters where acoustical treatment has been used excessively. This form of
post processing is offered only as an estimate of what might happen in a domestic living space
with carpet on the floor and a “normal” amount of seating, drapes and cabinetry. Reverberation
time would typically be in the vicinity of 0.4 s and relatively constant with frequency over most of
the frequency range.
For these limited circumstances it has been found that a usefully accurate Predicted In-Room
(PIR) amplitude response, also known as a “room curve” is obtained by a weighted average
consisting of 12 % listening window, 44 % early reflections and 44 % sound power. At very high
frequencies errors can creep in because of excessive absorption, microphone directivity, and
room geometry. These discrepancies are not considered to be of great importance. Free-field
data of the kind shown in Figure 4 are generally trustworthy indicators of performance at very
high frequencies.
Takeaway is that in a typical living room environment without special acoustic treatment the power and early reflections smoothness would be more important than the listening window response, a lot more. Meaning that the nulls are invisible to the hearing system in such environment, the early reflections fill in. Of course the listening distance might affect some, especially if listening nearfield.
In the standard the listening window response gets only 12% weight in predicted in-room response (estimating response measured at listening spot) and power + early reflections get 88% combined. Hump in DI and ERDI can be smoothed out with the increased c-c trick and should give better sound in such environment, see GIF in post #48 . Easy to test with VituixCAD, open up your project or create one with the diffraction tool and play with the driver Y coordinate(s). The hump is worst when c-c is about 0.5wl - 1wl. While smoothest DI and ERDI is with 1/4wl, which is not possible unless MEH, the ~1.4 c-c gives DI and ERDI very close to this. As close as possible position often leads to this hump, c-c between 0.5-1wl.
It is hard to test which would be better sounding c-c configuration at home without two subjects side by side with different c-c. I would build something, and if the xo region sounds weird no matter how well tuned crossover, then I would try the other c-c distance (as close as possible, or the 1.2wl+). Since every listening room and situation is different, as they mention in the standard, either could work.
ps. the standard paper is free, I downloaded it from here Standard Method of Measurement for In-Home Loudspeakers (ANSI/CTA-2034
– Consumer Technology Association(R)
Didn't read it all yet, but we should all read it at some point in DIY journey 🙂
Last edited:
Olive/Harman's work is likely the basis for that standard (attached), and in Olive's work the on-axis and listening window count for MUCH more than 12%. Sound power was used primarily to quantify <300hz.
The problem with overweighting sound power is that in many rooms there can be so much reflection that dips get filled in and bumps smoothed out. But that doesn't represent what we hear (possibly due to integration times of the ear, especially the 50ms window).
When asked about the vertical polar plot, I meant one like this:
This represents a range of frequencies around the crossover. If you've ever played with these sims you know that when drivers are close relative to crossover wavelength the main lobe is quite large. As they move away the lobe gets narrower and at some point breaks into multiple lobes that are very narrow. My concern is that large variation may be an issue given small changes in listening position may result in large changes in perceived sound because the on-axis smoothness dominates preference relative to its "energy footprint" if you will.
Think of this experiment we have all done, where you move your head around and see how the sound changes. Sound quality can change quite a bit by going from directly on-axis to say, 2 foot up when you stand up. If sound power were all that counted this could not happen as the sound power hasn't changed, and 2 feet is not a huge change in where your head is in the sound power field.
Now I'm not saying ctc of 1.2-1.5wl is for sure worse than <.25wl. What I'm challenging is the notion that one person's contingent example is suddenly being touted as the conventional wisdom to be used generally. We need some modelling and actual experiments to see how generally true the effect is on PIR and preference, and where there is some tradeoff, a way to decide which way to go.
BTW if anyone can link to Kimmisoto's post about this, I'd like to see it so I understand the conditions in his example.
Attachments
Last edited:
- Home
- Loudspeakers
- Multi-Way
- A 3 way design study