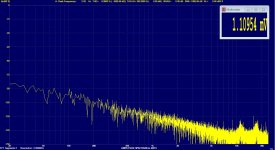
Hi. Does anyone know how to get the rms noise voltage for a given bandwidth from a spectrum graph? I mean, using a program like ARTA, REW or similar, get a noise plot using the Spectrum Display option and calculate e👎 or e^2👎.
Doesn't Virtins have a function for that? It involves averaging over the bandwidth, then dividing by the root of the bandwidth (141 for audio band) to get nV/RtHz.
Jan
Jan
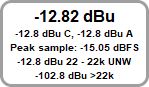
Perhaps not quite what you want, but the REW levels panel shows rms levels in the chosen Y axis units so if you select volts one of the figures is the unweighted rms level from 22.4 Hz to 22.4 kHz. The image below is with dBu as the axis unit.
You are right Jan, the function is "Noise Level", defined as the square root of the total noise power (or e👎). But how would you calculate it if you don't have this function (only the noise data over a frequency band, displayed on a Spectrum Analizer graph)?
Last edited:
You probably have to chop up the bandwidth in small slices, calculate each one separate and then integrate.
I would suspect that software like REW would do it similarly, only much faster ;-)
Jan
I would suspect that software like REW would do it similarly, only much faster ;-)
Jan
Perhaps not quite what you want, but the REW levels panel shows rms levels in the chosen Y axis units so if you select volts one of the figures is the unweighted rms level from 22.4 Hz to 22.4 kHz. The image below is with dBu as the axis unit.
Is this function specific to obtain the noise magnitude? Note that to obtain total of the noise in Vrms you have to work with noise power and then apply the square root to the result.
In any case, I am interested in a more didactic aspect, solving the problem without the help of the software, calculating the value from a spectrum analyser graph.
Last edited:
You probably have to chop up the bandwidth in small slices, calculate each one separate and then integrate.
I would suspect that software like REW would do it similarly, only much faster ;-)
Jan
Thanks Jan, it is indisputable that any SW will always be much faster and more accurate. It's just that using SW sometimes deprives you of understanding how things really work.
It would be nice to see an article with a practical example of how it's done (if anyone has seen it, I'd appreciate it if you'd let me know).
That REW figure was added to provide an in-band figure for noise measurements, with the ">22k" figure showing the out-of-band figure. It is the rms level of the input over the specified frequency range.
More generally such values are calculated by summing the FFT bin values over the desired frequency span, scaling to allow for FFT length and dividing by the noise bandwidth of the window function that was used. There is an old National Instruments application note that covers the topic well, "The fundamentals of FFT-based signal analysis and measurement". No longer available on the NI site since that was reorganised but there are copies to be found using search.
More generally such values are calculated by summing the FFT bin values over the desired frequency span, scaling to allow for FFT length and dividing by the noise bandwidth of the window function that was used. There is an old National Instruments application note that covers the topic well, "The fundamentals of FFT-based signal analysis and measurement". No longer available on the NI site since that was reorganised but there are copies to be found using search.
More generally such values are calculated by summing the FFT bin values over the desired frequency span, scaling to allow for FFT length and dividing by the noise bandwidth of the window function that was used. There is an old National Instruments application note that covers the topic well, "The fundamentals of FFT-based signal analysis and measurement". No longer available on the NI site since that was reorganised but there are copies to be found using search.
Thanks John, I found the document and will read it this weekend 🙂
If you don't know the FFT bin bandwidth, or the FFT window used, you cannot measure noise from a power spectrum plot.You are right Jan, the function is "Noise Level", defined as the square root of the total noise power (or e👎). But how would you calculate it if you don't have this function (only the noise data over a frequency band, displayed on a Spectrum Analizer graph)?
You need a power spectral density plot (PSD), which is scaled so that noise "power" per unit bandwidth is the reference. (volts squared is often a proxy for actual power, note). Since noise power is per unit bandwidth using wider FFT bins will see more noise per bin, without changing the height of signal peaks.
And FFT windows each have an effective noise bandwidth that you have to compensate for as well. So if your measurement software has separate power spectrum and power spectral density plots, deploy the latter. If not you need to check what the window is, and the FFT bin width (which is the sampling frequency divided by the number of points in the FFT), and calculate the conversion in dB between PS and PSD. [ assuming the setup is calibrated in the first place of course ]
I've seen a neat kind of plot in some paper once which showed the cumulative noise power across the plot, so that the level of this trace at the RHS was the total noise power.
- Home
- Design & Build
- Software Tools
- Noise calculation