This may belong in the 'Test Equipment' section, but I thought I might share a 3D graph of a 6CA7 transfer curves I measured. There is beauty in it's simplicity!
I put together a concept tube tester based on a RPi and Microchip PIC to make these measurements. (Total cost without the RPi screen and anode transformer is about USD 80). Total measurement time (for 6500 data points) was 40 seconds, excluding tube heating time.
The original purpose of the project was to build a self contained tester that was not tied to a laptop/computer, that was fast, let the tube reach normal operating temperatures (ie not pulsed), but still gave full access to the raw measured data so it can be manipulated with Python script.
Attachments


Very interesting.
Will you share the design with us ?
Sure, no problem, however this is not something new or original. It's just that it has been cobbled together using commonly available parts.
I use a classic tube measurement method of using a rectified voltage for Va, (so Va is being swept twice every mains cycle) then measure the corresponding Ia/Is over the first half of the mains cycle (5ms in this country).
The PIC can take 65 measurements (Va and I) in 5ms and that gives you a single trace at a Vg determined by the RPi.
Vg is generated by a simple negative voltage amplifier that takes the reference from a DAC controlled by the RPi. This gives a range of 0 to -100V.
Ia and Is are measured with a series resistor and opamp current amplifiers. The amplifier gain has 3 settings that gives an effective range of 1-300mA.
A sync pulse is generated close to Va=0 to start the measurements. These are performed as fast as the PIC can and stored in an array.
The RPi is coded in Python. I use a 8 GPIO pins from the RPi to communicate with the PIC. The PIC does the Va,Vs, Ia,Is ADC conversion and transfers the array to the RPi.
After that the post processing of the data is done using standard Python library routines (e.g. matplotlib and numpy), or use a variety of programs to extract Spice parameters (eg extractmodel (windows based)) or the curve matching application by Dmitry Nizhegorodov.
The PIC code is in C (C-- in my case...) haha
If anyone wants any further detail let me know.
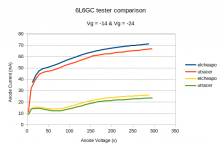
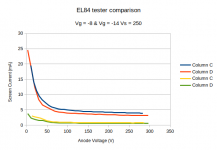
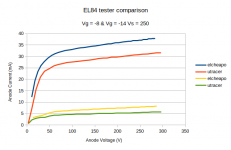
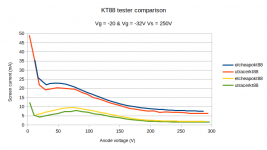
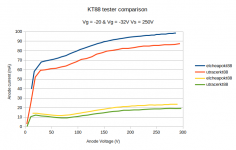
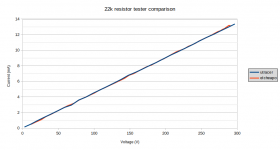
Comparing elCheapo tester with uTracer
I have now made a number of comparisons between the uTracer and elCheapo testers.
One of my motivations for building elCheapo was to run the tubes under 'normal' average powers, similarly to what one may find in a real circuit, rather than the low duty cycle uTracer employs. I have always suspected that for power tubes the measured results between low power pulsed and higher powers differs substantially.
I have spent some time getting the elCheapo calibrated and am pretty satisfied that I am reading voltage and current within about 1% or so, and Vg is accurate to within 50-100mV. I have checked the uTracer by measuring the actual pulse voltages for Va and Vs, and checked both Ia and Is current measurements. These have similar accuracy to elCheapo, and are pretty satisfactory.
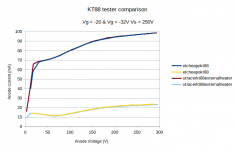
The first graph shows a comparison between the testers using a 22k resistor connected between cathode and anode test points. There is good agreement.
The next sequence of graphs show the differences between the testers on a selection of tubes. As you can see there is a substantial difference, greater than I would have expected.
As a sanity check I connected the KT88 to a bench dc anode (250V) and screen (250V) supply and measured Ia and Is with bench instruments. Both Ia (98.6mA) and Is (7.9mA) were within 1mA of the elCheapo readings.
I hope those of you interested in measurements will find this interesting. Let me know if you think I may have missed something...
I have now made a number of comparisons between the uTracer and elCheapo testers.
One of my motivations for building elCheapo was to run the tubes under 'normal' average powers, similarly to what one may find in a real circuit, rather than the low duty cycle uTracer employs. I have always suspected that for power tubes the measured results between low power pulsed and higher powers differs substantially.
I have spent some time getting the elCheapo calibrated and am pretty satisfied that I am reading voltage and current within about 1% or so, and Vg is accurate to within 50-100mV. I have checked the uTracer by measuring the actual pulse voltages for Va and Vs, and checked both Ia and Is current measurements. These have similar accuracy to elCheapo, and are pretty satisfactory.
The first graph shows a comparison between the testers using a 22k resistor connected between cathode and anode test points. There is good agreement.
The next sequence of graphs show the differences between the testers on a selection of tubes. As you can see there is a substantial difference, greater than I would have expected.
As a sanity check I connected the KT88 to a bench dc anode (250V) and screen (250V) supply and measured Ia and Is with bench instruments. Both Ia (98.6mA) and Is (7.9mA) were within 1mA of the elCheapo readings.
I hope those of you interested in measurements will find this interesting. Let me know if you think I may have missed something...
Attachments


I've been quietly reading this, rather intrigued.
I have only recently begun building with valves, and have made efforts to match them, when the best way is to curve trace. I looked at uTracer, and whilst it looks good (better then I could do), the limited voltage range and I wasnt all that sure about pulsed method either.
For one, I would expect that pulsed testing could potentially create overshoot on the rising edge transition to plateau, in a less stable pentode, and that could cause error in measurement. So I'm 100% with you with the 'normal operation' mode of testing.
I've been looking for a good way to accomplish curve tracing on a DSO, CRO with some simple supplies, ramp generator. It's still quite a set up.
This is where I like your approach very much:
It could be packaged as a hobbyist friendly tester for valves
(uTracer is maybe more hobbyist friendly on first glance, but let's face it, if you have valves and want to test them, then you have the supplies, or something which can be adequate.)
If your tester was contained in a box, with connections for DC and HTR supplies supplied externally, then that's pretty much perfect in my opinion.
Update on comparison...
So, after a glass of wine or two I read some old threads about the uTracer built-in heater supply 'problems'
I have seen these references before, but not paid them much attention, not realising the deviation I am seeing is quite possibly as a result of this deficiency.
I have remeasured the 5881 on the uTracer using an external dc 6.3V heater supply and the match between elCheapo and uTracer is now pretty good.
Makes me feel more comfortable but also somewhat irritated that I did not pay enough attention to this uTracer feature before. Or perhaps there is already a fix and I don't know about it?
I did not realise that the heater power would make that much difference.
Attachments

and even the KT88 is now happy
KT88 with external dc heater now in good agreement with elcheapo.
So perhaps the overall power dissipation does not matter that much...?
I guess it is satisfying that two quite different measurement methods yield the same result...?
KT88 with external dc heater now in good agreement with elcheapo.
So perhaps the overall power dissipation does not matter that much...?
I guess it is satisfying that two quite different measurement methods yield the same result...?
Attachments
If your tester was contained in a box, with connections for DC and HTR supplies supplied externally, then that's pretty much perfect in my opinion.
Yes, and, because the tester is built using free and open source software it is very flexible. You have complete control of what the tester does. You are not limited to a fixed GUI or output format.
I enjoy the post-processing of the data using Python and displaying the results.
This was not intended to be a uTracer comparison, and I will continue to use it for certain tests (such as stressing the tube under test beyond the manufacturer's limits, which you can do due to the low duty cycle)
No the uTracer is also very impressive, and given your revised results, when using external heater supply, it confirms both devices are measuring very much the same result.
Reassuring that there is so little between their results.
Having flexibility in the front end GUi and data outputs is good, and I dont know what extent you have gone to have ALL permutations, but keeping organised becomes more difficult. Not a problem if it's a GUI for you and only you, but perhaps less universally appreciable?
Not a problem if it's a GUI for you and only you, but perhaps less universally appreciable?
Yes I agree. A bit like Windows vs Linux?
I don't use a GUI, just command line style Python scripts.
My only 'plan' is to box the hardware to make it safe and robust, but it will always remain a bench experiment.
I did something similar, using an adjustable supply I built, which goes up to about 180V for Va, and -25V for Vg. Rather than sequence the voltages automatically I had a set of voltage dividers or current shunts going to an Arduino's analog inputs and just recorded a stream of data points as I varied the two voltages by knob-twiddling!
Then the data went similarly through Python's numpy/matplotlib libraries to display various graphs including a 3D one:

A plot of a 6BA6 pentode, suppressor connected to cathode, screen grid not sure, perhaps triode connected? Vertical is mA anode current.
Never got round to properly automating this like your efforts...
Then the data went similarly through Python's numpy/matplotlib libraries to display various graphs including a 3D one:
A plot of a 6BA6 pentode, suppressor connected to cathode, screen grid not sure, perhaps triode connected? Vertical is mA anode current.
Never got round to properly automating this like your efforts...
Very nice! Now you just need something to make Spice models using your data.
Well, here is a first shot at extracting Spice parameters for a triode (5881 triode connected), and it looks encouraging.
This is the Koren model that has only 5 parameters (so it is a relative easy starter) and is used by Derk Reefman's ExtractModel program, so it gives me something to compare to.
In fact I am using Derk's 2014 rather comprehensive paper on this topic as my guide ("Spice models for vacuum tubes using the uTracer", available from Ronald Dekker's site IIRC).
Not being very clever on the art of mathematics, I have thrown the Nelder-Mead minimisation algorithm (as suggested by the Luleå Academic Computer Society's Kurvmatch web page) at my measured data via the SciPy.org minimize(method=’Nelder-Mead’) module.
It will be interesting how well it works with Derk's pentode model.
Attachments

Hope no one minds my asking if there is a inexpensive (free) way to plot 3D curves? I might be inclined to play around a bit in the future if there is.
I used Matplotlib: Python plotting — Matplotlib 3.1.1 documentation
It is free. Look at the examples, it is easy to use.
It is free. Look at the examples, it is easy to use.
I used Matplotlib: Python plotting — Matplotlib 3.1.1 documentation
It is free. Look at the examples, it is easy to use.
Thanks.
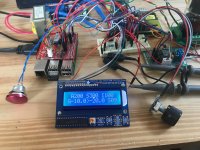
el Cheapo update
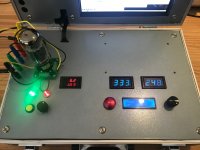
Here is an update on my DIY tube curve tracer.
I have used an Al toolbox as the enclosure. It's bigger than it needs to be but it does the job.
Final voltage and current ranges are as follows:
Anode sweep voltage: 0-150, 0-200, 0-300, 0-400V; Iamax = 300mA
Screen fixed voltage: 100-300V in 10V increments; Ismax = 100mA
Grid fixed voltage: 0 to -100V in 0.1V increments
Measure a batch of Ia and Is for up to 99 grid voltage steps at a fixed screen voltage;
Measure up to 9 batches sequentially (all test parameters can be changed for each individual batch)
Estimated accuracy:
Va 2%
Vs +- 1%;
Ia +- 2% & +- 0.4mA;
Is +- 1% & +- 0.1mA;
Vg +- 0.1V
Attachments
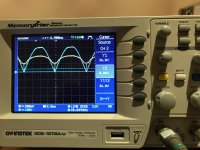
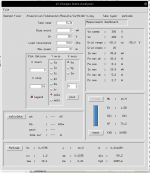
lock down fiddling...
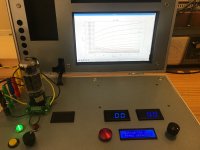
Lock down has meant messing about with my el Cheapo curve analyser.
Attached is a screenshot of my post-processing GUI and a sample SPICE curve match using Derk Reefman's models.
I have made extensive use of Derk's 2016 paper on the model theory, but I remain pretty much a copy and paste guy!
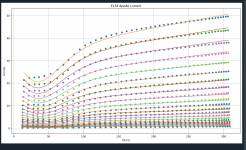
There is still much work to be done but it looks encouraging. Both triode and pentode model parameters can be extracted with decent accuracy.
Attached are some sample data/model comparisons for an JJ El34.
Lock down has meant messing about with my el Cheapo curve analyser.
Attached is a screenshot of my post-processing GUI and a sample SPICE curve match using Derk Reefman's models.
I have made extensive use of Derk's 2016 paper on the model theory, but I remain pretty much a copy and paste guy!
There is still much work to be done but it looks encouraging. Both triode and pentode model parameters can be extracted with decent accuracy.
Attached are some sample data/model comparisons for an JJ El34.
Attachments
- Home
- Amplifiers
- Tubes / Valves
- 3D tube curves using an el'Cheapo tube tester