Hi David, I've been meaning to ask something for a while now. How come when simulating a standard reflex enclosure in Hornresp, the tuning is drastically altered by radiation angle (i.e. 0.5 vs 4.0 Pi)?It is not clear to me what assumptions are made as far as solid radiation angle is concerned
KInd regards Johan
How come when simulating a standard reflex enclosure in Hornresp, the tuning is drastically altered by radiation angle (i.e. 0.5 vs 4.0 Pi)?
Hi Johan,
Reducing the solid radiation angle (for example by changing Ang from 4.0 Pi to 0.5 Pi) increases the acoustical impedance loading the port tube outlet at low frequencies. This in effect increases the outlet "end correction", which reduces the Helmholtz resonance frequency of the system.
Kind regards,
David
Thanks David, is this end-correction a fixed number, regardless of the port?
That would explain why I noticed, that with a long port the difference is just a few Hz (due to the end-correction), whereas with a short port the simulated difference was much as 25 Hz (difference between 0.5 and 4.0 Pi). Which seems a bit excessive unless you say it's legit?
Kind regards Johan
That would explain why I noticed, that with a long port the difference is just a few Hz (due to the end-correction), whereas with a short port the simulated difference was much as 25 Hz (difference between 0.5 and 4.0 Pi). Which seems a bit excessive unless you say it's legit?
Kind regards Johan
Wut? After you enter the t/s into Hornresp you can verify the parameters as Brian mentioned by double clicking Sd. It should be the same parameters you are entering into WinISD so t/s differences are not an issue, they are not different.
It should be but isn't always. See, you always only get the results
Ok, take a look at that sim you just posted and look at the one Chris linked to which includes the measurement. The measured and Hornresp simulated graphs have a 7 db hump at 35 hz (compared to 100 hz level). The sim you did shows a 2 db hump at 40 hz. How is that even remotely similar?
Which curve are you talking about? The 7dB Hump in the lower one at 35Hz is not the actual measurement, that's the incorrectly simulated one of hornresp. If you are talking about about the upper one, hornresp got a deviation of -2dB. That's a lot more difference than BassCADe's simulation.
The additional 2 dB difference is above the hunch, that's the serial resistance. However, you DO see where the normal response would be and see immediately how much the enclosure hunches up - which you do not at hornresp. That makes it actually a lot easier to predict how boomy the construct will sound, especally if power compression comes into play. The additional level difference is because of the high inductance, which isn't simulated but I already said that.
Now about the difference in the hunch frequency. I expected someone familiar with simulations to know that the hunch will wander because if you add a serial resistance, the level above will drop. You do notice, I entered '0 Ohm Serienwiderstand' in the former simulation. And that makes the hunch drop to a lower frequency. That is the effect of the serial resistance. If I enter a value of just 0,5 Ohm, what would be realistic, hornresp does this probably by default or was separately entered, I don't know how that simulation was achieved, mine looked quite different. Now that entered, look what it does to the simulation:

See how the hunch is now lower? The difference is actually practically non-existant if you don't tie yourself to the marked frequency since the hunch is a bit wider.
Let's understand that all these different programs are doing different calculations. The basic theory is the same but some include things like port end corrections while some don't.
That's exactly my point. Some things are better used with either or other program, depending on what you're doing. And for BR, WinISD and BassCADe give you a very quick, precise and easy to understand impression of what to expect, even at 'messy' or some missing parameters. For other uses or special, non-standard enclosure types, hornresp is indeed better suited or the type isn't even included in the other programs.
Who knows what BassCAD is doing? If it doesn't even accept an Le parameter it can't be doing much right. Maybe it's simulating Ql, Qa and Qp, maybe not. Maybe it's doing other things. But clearly it is not producing an accurate sim.
You are quick judging about a program you've obviously never used. It does use Ql. And it does produce accurate sims, identical to WinISD. Compare it, if you adjust it to the same scale, it's identical.
Note the following:
- The uncorrected Hornresp simulation and the WinISD simulation are the same below 100Hz
- NEITHER OF THEM ARE EVEN A TINY BIT CLOSE TO WHAT'S ACTUALLY MEASURED.
- The measured response is actually very close to the Hornresp sim with Lossy Le enabled.
You call an average deviation of 2dB over the whole important range the same? 😕Oh well, nothing to add here. 🙄
The 7dB Hump in the lower one at 35Hz is not the actual measurement, that's the incorrectly simulated one of hornresp.
Um, the actual measured response of the subwoofer shows that big hump at 35 Hz. The "Lossy Le" curve generated by Hornresp (the red curve in the captured Hornresp window) comes the closest to the subwoofer's measured response. All of the other sims are way off.
Ok, just to be super clear, the measured response is the top image, the two wiggly lines. That's the response as measured by data-bass. In the bottom image you see two hornresp sims - the one with the small hump is a regular sim and is quite similar to what WinISD or Bassboxcade or whatever would produce. The trace with the 7 db inductance hump is the sim that is corrected for lossy le losses, and it matches the measured response very well. None of the other sims match at all - not the simple hornresp sim, not the WinISD sim, not the Bassboxcade sim.
I'm not sure how you missed this unless you simply didn't know what the graphs actually are showing, which is pretty fundamental.
As for the rest, arguing that sims can be more accurate if they take less information into account is pretty ridiculous. The more information you account for the more accurate the sim will be. I actively sought out the software that is the most accurate and landed on Hornresp, Akabak, TL.app and MJK's worksheets... whereas WinISD, Bassbox Pro, Bassboxcade, Unibox and all the rest of the simple helmholtz simulators belong in the garbage, IMO anyway.
Ok, just to be super clear, the measured response is the top image, the two wiggly lines. That's the response as measured by data-bass.
The blue one is clearly a measurement, that was clear. The red one does not look like a typical measurement though, looking at the upper part of it, it got obviously a different smoothing. I find it rather odd to do that on measurements and mix ones with different measurement methods and only the half of it was even posted (no info on the equipment, smoothing, measurement enviroment, mic or measurement software and -mode). And I used the D2 parameters since Qts and Qes were identical on the D1 - which is physically/mathematically impossible.
As for the rest, arguing that sims can be more accurate if they take less information into account is pretty ridiculous.
What the.. ?! I never claimed that! I said it is because they use different information/parameters they are closer on extreme ported enclosures. I got a lot of different results for BR from hornresp which deviates far more from measurements, some would have lead to absolutely unusable subs. The result on this example is very close, 38 vs. 35Hz is not far off considering the top of the curve is flat/wide, that's less than 8%, I'd rather read 37Hz out of the measurement which would be just 2,7% off. Drivers got much higher tolerances on fs etc. Should we start counting pixels on the measurement now?
The more information you account for the more accurate the sim will be.
IF they are correct. And looking at the measurements a lot of folks do and by how much they differ on not only the same model but on the exact, same driver. If your parameters deviate, you can get to much different simulation results. The integrity of the TSP data is often off, like I mentioned on the data above. But that's not all, some folks enter completely wrong data, can't even read the Xmax out of a datasheet and if pointed out that's an error, are still ignorantly claiming their resulting max spl would OFCOURSE be correct, still violently defending it.
I actively sought out the software that is the most accurate and landed on Hornresp, Akabak, TL.app and MJK's worksheets... whereas WinISD, Bassbox Pro, Bassboxcade, Unibox and all the rest of the simple helmholtz simulators belong in the garbage, IMO anyway.
That's fine. You don't have to use it. If you get your parameters from a lot different sources, the differences add up or even multiply. In these cases, such a 'simple' helmholtz resonator program has much less user- or data-error sources and does, in fact, often lead to more usable results. And a lot of people are having a hard time to 'filter out' or smoothen themselves the peaks of the hornresp simulations or generally interpreting them, which leads to loads of unnecessary follow up questions which cause even more questions and needed in-depth explainations. And they (very often) can't use more complex software. I do however, also use other software, depending on the case but for me, such a 'simple' simulation tool is often exactly what's needed.
Hi Johan,
Most simulation programs calculate the port outlet end correction as 8 / (3 * Pi) * (S / Pi) ^ 0.5 where S is the port cross-sectional area. This formula assumes half-space radiation. Hornresp does not add an end correction as such, which is why I referred to it in inverted commas in my earlier post. Hornresp instead takes into account the actual calculated acoustical impedance load for the given solid radiation angle.
For both methods though, the "end correction" is not a fixed value regardless of the port. It depends upon the port cross-sectional area, and in the case of Hornresp, on the specified solid radiation angle also.
For a given port cross-sectional area, the shorter the port tube length, the greater will be the effect of adding the end correction.
Kind regards,
David
is this end-correction a fixed number, regardless of the port?
Most simulation programs calculate the port outlet end correction as 8 / (3 * Pi) * (S / Pi) ^ 0.5 where S is the port cross-sectional area. This formula assumes half-space radiation. Hornresp does not add an end correction as such, which is why I referred to it in inverted commas in my earlier post. Hornresp instead takes into account the actual calculated acoustical impedance load for the given solid radiation angle.
For both methods though, the "end correction" is not a fixed value regardless of the port. It depends upon the port cross-sectional area, and in the case of Hornresp, on the specified solid radiation angle also.
That would explain why I noticed, that with a long port the difference is just a few Hz (due to the end-correction), whereas with a short port the simulated difference was much as 25 Hz (difference between 0.5 and 4.0 Pi).
For a given port cross-sectional area, the shorter the port tube length, the greater will be the effect of adding the end correction.
Kind regards,
David
Last edited:
The blue one is clearly a measurement, that was clear. The red one does not look like a typical measurement though, looking at the upper part of it, it got obviously a different smoothing. I find it rather odd to do that on measurements and mix ones with different measurement methods and only the half of it was even posted (no info on the equipment, smoothing, measurement enviroment, mic or measurement software and -mode). And I used the D2 parameters since Qts and Qes were identical on the D1 - which is physically/mathematically impossible.
Red one's also a measurement, possibly at 1m or something.
Look around the databass website, there's plenty of info on how things were measured.
What the.. ?! I never claimed that! I said it is because they use different information/parameters they are closer on extreme ported enclosures. I got a lot of different results for BR from hornresp which deviates far more from measurements, some would have lead to absolutely unusable subs. The result on this example is very close, 38 vs. 35Hz is not far off considering the top of the curve is flat/wide, that's less than 8%, I'd rather read 37Hz out of the measurement which would be just 2,7% off. Drivers got much higher tolerances on fs etc. Should we start counting pixels on the measurement now?
On databass, they measured (and posted) the T/S parameters of the exact drive unit that they then produced measurements for. Can't get more accurate than that.
You're still ignoring the fact that the Lossy-Le simulation AND the measurements both show 35Hz being +7dB over 100Hz, and your simulations show +2dB, at a different frequency!
But that's not all, some folks enter completely wrong data, can't even read the Xmax out of a datasheet and if pointed out that's an error, are still ignorantly claiming their resulting max spl would OFCOURSE be correct, still violently defending it.
Taking shots at me in my own thread?
Lovely, thanks for that. I've already admitted I made a mistake by assuming the drivers I had and the B&C 6PS38 they're based on would have the same Xmax. That wasn't about reading a datasheet (which I'm perfectly capable of, thank-you-very-much), that was about having different drivers.
That's fine. You don't have to use it. If you get your parameters from a lot different sources, the differences add up or even multiply. In these cases, such a 'simple' helmholtz resonator program has much less user- or data-error sources and does, in fact, often lead to more usable results. And a lot of people are having a hard time to 'filter out' or smoothen themselves the peaks of the hornresp simulations or generally interpreting them, which leads to loads of unnecessary follow up questions which cause even more questions and needed in-depth explainations. And they (very often) can't use more complex software. I do however, also use other software, depending on the case but for me, such a 'simple' simulation tool is often exactly what's needed.
Now you're complaining that newbies are going to end up learning something!
There's a lot of evidence to suggest that the simple simulators (WinISD, BassCAD, etc etc etc) aren't accurate for high-inductance drivers in sealed boxes, which are literally the simplest cabinets. I don't see why you're still defending those simulators.
They work fine for low-inductance drivers, but with the increasing popularity of high-excursion high-inductance subwoofer drivers, I'd rather have something that can simulate them accurately.
Chris
Well this thread took an unexpected turn. 😀
The Data-Bass measurements shown in the article are from the same sealed cab taken a 1m GP and at 10m GP. The 10m GP measurement has 1/12th smoothing applied. The 1m measurement has none. Details of the equipment, measured driver parameters, cab specs, measurement details,etc are listed at DB. I'm not going to repeat it all here.
ICG,
Have you ever measured the frequency response of a subwoofer in an outdoor or half-space environment? Do you have the driver parameters and cabinet specs from the measured system? If you do and you compare the simulated to measured response, you will find that the measured response does not match the simulated response from winisd, or any other simple TS derived simulation program very well at all. If you have never done this direct comparison before it is eye opening.
Inductance effects are a part of any moving coil electromagnetic system. There is a reason why Klippel testing includes analyzing the inductive performance. It has a large effect on the drivers behavior. Yes even for subwoofers and yes even below 80Hz. Saying that inductance doesn't matter for subwoofers or affect the response below 80Hz is factually incorrect.
Winisd and other simple simulation software, which does not account for inductance, will not produce a simulation that performs like the real speaker. It is missing a critical piece of information that can have huge effects on the behavior of the speaker/cabinet system. Winisd can be forced to incorporate some inductance data and more closely match the real speaker but it is trial and error and would usually involve measuring a real system first so that it is known what the real response is. Not very helpful and very tedious. For sealed or IB systems it may not be a big deal to have a more accurate simulation. For higher order more complex systems such as BP6, TH, FLH, CH, etc...It becomes a much bigger deal.
Last edited:
It looks like that's been laid to rest.
Back to the 3x6" bass module thing, then.
This is a slot-loaded ported box again. I quite like that sort of cabinet, for a few reasons:
- Option for air-flow over driver magnets
- Some distortion masking
- Improves top-end efficiency a little
- No directly exposed drivers
Here's a simulation:

This is with 18v drive level into the three drivers in parallel. Excursion touches 4mm one-way. Grey trace is the mid-high speakers with 50v and Xmax=5mm, while flown. Looks like there's around 10dB more output from the subs available.
Next up, the maximum SPL you can get with this cabinet, with up to 50v input and Xmax=4mm:

Looks like it could be a fairly loud little box.
Of course, if you let excursion get to 5mm, it'll start sounding more stressed but will put out a little more volume. 4mm is pretty safe.
The cabinet interior comes out around 56L all done, which should work out to be a usefully wide base.
I'm going to play around a little more and see if the volume can be dropped a little - as it is, it's a very efficient cabinet, but runs out of headroom quickly. If I can make it smaller and apply a little more power to get the same SPL, that'd be worthwhile.
Chris
PS - Hornresp inputs for those following along:
Back to the 3x6" bass module thing, then.
This is a slot-loaded ported box again. I quite like that sort of cabinet, for a few reasons:
- Option for air-flow over driver magnets
- Some distortion masking
- Improves top-end efficiency a little
- No directly exposed drivers
Here's a simulation:
This is with 18v drive level into the three drivers in parallel. Excursion touches 4mm one-way. Grey trace is the mid-high speakers with 50v and Xmax=5mm, while flown. Looks like there's around 10dB more output from the subs available.
Next up, the maximum SPL you can get with this cabinet, with up to 50v input and Xmax=4mm:
Looks like it could be a fairly loud little box.
Of course, if you let excursion get to 5mm, it'll start sounding more stressed but will put out a little more volume. 4mm is pretty safe.
The cabinet interior comes out around 56L all done, which should work out to be a usefully wide base.
I'm going to play around a little more and see if the volume can be dropped a little - as it is, it's a very efficient cabinet, but runs out of headroom quickly. If I can make it smaller and apply a little more power to get the same SPL, that'd be worthwhile.
Chris
PS - Hornresp inputs for those following along:
Code:
ID=42.00
Ang=2.0 x Pi
Eg=18.00
Rg=0.00
Fta=0.00
S1=200.00
S2=200.00
Par=25.00
F12=0.00
S2=200.00
S3=200.00
Par=25.00
F23=0.00
S3=0.00
S4=0.00
L34=0.00
F34=0.00
S4=0.00
S5=0.00
L45=0.00
F45=0.00
Sd=132.00
Bl=11.17
Cms=2.65E-04
Rms=1.60
Mmd=13.77
Le=0.26
Re=9.24
OD=3P
Vrc=40.00
Lrc=11.90
Ap=200.00
Lpt=32.00
Vtc=0.00
Atc=0.00
Pmax=150
Xmax=4.0
Path=0.0
Mass=0.00
Fr1=0.00
Fr2=0.00
Fr3=0.00
Fr4=0.00
Tal1=100
Tal2=100
Tal3=100
Tal4=100
Comment= 3x6
~~~~~~~~~~~~~~~~~~~~~~~~~~~~~~~~~~~~~~~~~~~~~~~~~~~~~~~~~~~~~~~~~~~~~~~~~~~~~~~~~~~~
FILTER
      0   0.01    0.0     -1      0   0.01    0.0     -1      0   0.01    0.0     -1
      0   0.01    0.0     -1      0   0.01    0.0     -1      0   0.01    0.0     -1
  100   50   39   94
  40.50.50.5
0.50.50.50.5
SSSS
0111
1134
2222
1111
111
103
~~~~~~~~~~~~~~~~~~~~~~~~~~~~~~~~~~~~~~~~~~~~~~~~~~~~~~~~~~~~~~~~~~~~~~~~~~~~~~~~~~~~
Last edited:
Back again.
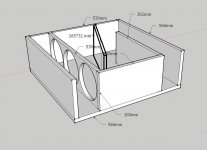
So, here's a quick sketch of the cabinet so far. I've dropped the rear chamber to 30L, which lost a couple of dB around 60Hz but gained a little bit of power handling.
It looked something like this:

However, the slot port comes quite close to the back corner of the cabinet, which would effectively increase the path length.
It took quite a lot of messing around to incorporate that effect and then adjust the length until a 60Hz tuning was achieved.
I ended up with the port panel 250mm long, down from the 330mm I started with. Both should have 18mm added to include the front panel.
NB - leaving the port panel 330mm long would've resulted in a tuning around 52Hz.
Here's how I did it:
Taking into account the advanced centreline method, slot-loaded ported boxes should probably be simulated like this:

Pull the numbers off it, with a 180mm internal height, and the Hornresp input for the ported chamber looks like this:

Schematic:

With the drivers receiving around 40w each to hit Xmax, I'm going to mount the drivers with magnets inside the ported chamber. In a high-power situation, I'd want better ventilation around the magnets, but this sub doesn't need much power to perform. It does mean the centre of gravity will be somewhere near central as-is, so I won't have to buy up some cast iron weights to balance the thing.
I won't be adding an access panel, since I have exactly six of these drivers, and there aren't any more on the market. As a result, once I've tested a cabinet with foam gaskets and clamps to check the port tuning, I'll be gluing it shut. If I blow a driver, I'll cut open the cabinets to recover the remaining drivers and use them for something else.
Similar 6" PA midbass drivers do simulate well in this cabinet. Things like the 18Sound 6ND430, for example. However, I don't want to have to buy six of them as they're really not cheap.
As a result, if I do blow a driver or two, I'll probably see what there is in the 10" range that'll go into something similar.
That's all for now.
Chris
So, here's a quick sketch of the cabinet so far. I've dropped the rear chamber to 30L, which lost a couple of dB around 60Hz but gained a little bit of power handling.
It looked something like this:
However, the slot port comes quite close to the back corner of the cabinet, which would effectively increase the path length.
It took quite a lot of messing around to incorporate that effect and then adjust the length until a 60Hz tuning was achieved.
I ended up with the port panel 250mm long, down from the 330mm I started with. Both should have 18mm added to include the front panel.
NB - leaving the port panel 330mm long would've resulted in a tuning around 52Hz.
Here's how I did it:
Taking into account the advanced centreline method, slot-loaded ported boxes should probably be simulated like this:
Pull the numbers off it, with a 180mm internal height, and the Hornresp input for the ported chamber looks like this:
Schematic:
With the drivers receiving around 40w each to hit Xmax, I'm going to mount the drivers with magnets inside the ported chamber. In a high-power situation, I'd want better ventilation around the magnets, but this sub doesn't need much power to perform. It does mean the centre of gravity will be somewhere near central as-is, so I won't have to buy up some cast iron weights to balance the thing.
I won't be adding an access panel, since I have exactly six of these drivers, and there aren't any more on the market. As a result, once I've tested a cabinet with foam gaskets and clamps to check the port tuning, I'll be gluing it shut. If I blow a driver, I'll cut open the cabinets to recover the remaining drivers and use them for something else.
Similar 6" PA midbass drivers do simulate well in this cabinet. Things like the 18Sound 6ND430, for example. However, I don't want to have to buy six of them as they're really not cheap.
As a result, if I do blow a driver or two, I'll probably see what there is in the 10" range that'll go into something similar.
That's all for now.
Chris
I think the Advanced Centerline method breaks down when you try to map a large discontinuity with it, like what you've tried there. A sanity check - make the shelf vent just half the length of the back panel. the AC method suggests that the effective length of the vent will be 3/4s the length of the back panel, and we know that's not going to be the case.
You can avoid this issue by doing what I did - model and build the enclosure like an MLTL (see my POC design). The extra internal panel acts as good bracing and the AC method can effectively be used to describe the path through the enclosure because there's no discontinuity to worry about, once you've optimized the length of the vent and the internal panel. My MLTL workbook can assist with that, well at least partially because you have the drivers located on a different panel 🙂
You can avoid this issue by doing what I did - model and build the enclosure like an MLTL (see my POC design). The extra internal panel acts as good bracing and the AC method can effectively be used to describe the path through the enclosure because there's no discontinuity to worry about, once you've optimized the length of the vent and the internal panel. My MLTL workbook can assist with that, well at least partially because you have the drivers located on a different panel 🙂
Attachments
Hi Brian,
While I see your point, isn't that taken into account by using the large cross-sectional areas that arise from the path shown?
For what it's worth, the panel did end up about half the sub's depth, and using data from the ACL method and Hornresp, it looks like tuning should come out about right.
Chris
39L on SketchUp, 41.4L on Hornresp.
Guess the difference is volume of the port panel, give or take.
Guess the difference is volume of the port panel, give or take.
Double-posting, but I'd like to expand a little on a point made earlier.
I think (not certain) that the advanced centreline method still holds here. In the simulation and the drawing, the port panel is about 250mm long*, which is around half of the width of the cabinet.
With the simulation, what I've done is to incorporate the area going around the bend as part of the port, but I've given it a large cross-sectional area (as is seen as the air goes around the corner), and I've let Hornresp sort out which bit of air belongs to the cabinet airspace, and which bit belongs to the port.
I think that should mean the simulation is pretty accurate. While we can't simulate bends with Hornresp, the advanced centre-line method gives us a very good approximation of the path followed by the air, and I think that should apply here.
Chris
* On the drawing, the distances shown from the cabinet edge to the centre line aren't the full distance from one panel to the next, they're the distance measured from the centre-line to the panel, so they should be doubled.
39L on SketchUp, 41.4L on Hornresp.
Guess the difference is volume of the port panel, give or take.
That's a bit of a warning flag right there. I think that the Hornresp sim should always have a net volume that's a less than the box that you're trying to sim. Sketchup doesn't remove the volume of the port panel from its calculations?
The Data-Bass measurements shown in the article are from the same sealed cab taken a 1m GP and at 10m GP. The 10m GP measurement has 1/12th smoothing applied. The 1m measurement has none. Details of the equipment, measured driver parameters, cab specs, measurement details,etc are listed at DB. I'm not going to repeat it all here.
You're not repeating it? I've actually looked into the DB and did not find anything about the measurement microphone or the soundcard or preamp used. Nothing on calibration either. That means the measurements can't be verified.
But most importantly: They measured both times 90dB. But with an Re of 4,2 Ohm (just for calculations) and a voltage of 2V they get 0,95W. With 10m distance and a voltage of 20V they get 90dB too, but that's then 95W. At a distance of 20m that should be ~6dB less. How comes the curves match then? Hm, maybe one time nearfield and one time far field? That does not add up either, the 10m measurement loses then even more. You don't mix different measurement types. Do you really think it's a good basis to reference to a simulation then?
Have you ever measured the frequency response of a subwoofer in an outdoor or half-space environment?
Yes, I did. And I found that you get a lot different results depending on how you measure and what equipment you use. From perfect match to not-so-nice everything included. A GP measurement is the easiest and gives the 'prettiest' results. Free field in 3m height is nice too if the wind does not interfere but it's very impractical, I did that only once. Anyway, a GP measurement would differ a lot more from 1m height measurement than the DB ones do.
If you do and you compare the simulated to measured response, you will find that the measured response does not match the simulated response from winisd, or any other simple TS derived simulation program very well at all. If you have never done this direct comparison before it is eye opening.
I've done it. It actually was different from the simulation. But so was hornresps simulation too. The problem is, hornresps simulation was much more off of the measurement, both at the upper and the lower end. If both are not matching, would you not use the one that's closer?
Inductance effects are a part of any moving coil electromagnetic system. There is a reason why Klippel testing includes analyzing the inductive performance. It has a large effect on the drivers behavior. Yes even for subwoofers and yes even below 80Hz. Saying that inductance doesn't matter for subwoofers or affect the response below 80Hz is factually incorrect.
That is all true but the magnitude of impact is what matters. Most parameters are derived from Le and that is by far the most-off measurement, even for manufacturers because everyone measures it different. I don't doubt Klippel but they do know their stuff far better than many manufacturers, after all. But usually you have to rely on the manufacturers data, don't you?
- Status
- Not open for further replies.
- Home
- Loudspeakers
- Subwoofers
- Small PA Subwoofer - 3x 6.5" drivers.