No the objections are not moot, not even close.
I want to see the shifting parameters of ONE driver (two measurements OF THE EXACT SAME DRIVER DONE IN QUICK SUCCESSION) to show the shift).
I DON'T want to see the one set of t/s parameters for three completely different drivers, which have natural consistency variance. How can I use that data?
The point here is to see how ONE driver is affected in both t/s parameters and in a box sim by moderate differences in power as would be seen by a dynamic hit or a slight increase in spl (volume knob). The info you provided in that link has no bearing on this investigation, it just shows a single set of measured t/s parameters for 3 different drivers, measured at different times by different people with different equipment.
I DON'T want to see the one set of t/s parameters for three completely different drivers, which have natural consistency variance.
My measures and Mark's are (essentially) for the same driver. Use the data. Quit making lame excuses.
I well know how much production drivers vary… i have measured 1000s. Well over 200 (measured many times) of the driver that the data is for.
dave
My measures and Mark's are (essentially) for the same driver. Use the data. Quit making lame excuses.
I well know how much production drivers vary… i have measured 1000s. Well over 200 (measured many times) of the driver that the data is for.
dave
This isn't a lame excuse. I want to do something very specific - sim these shifting t/s parameters you have been talking about. How does a single measurement a of different drivers done by two people accomplish that?
I need two t/s measurements of a single driver, one done at low power (millivolts) and one done at moderate power (say 10 watts or under) to sim and see how the frequency response changes.
You have offered a single measurement of two different drivers from two different people. What am I supposed to do with that? All it (likely) shows is that the two tested drivers are not consistent with each other and there could be dozens of reasons for that, including the measurement equipment and procedure.
Last edited:
Here's the post by Jeff Bagby that I was talking about earilier. Note especially the part in bold (bolded by me). This gets to the heart of the issue and shows that these "drifting in and out of tune" arguments are pure nonsense. The parameters change in mostly complimentary ways to produce the same response curve until you get into power compression territory.
This is not an uncommon viewpoint, it's been expressed many times by many people that know what they are talking about. And power compression measurements (a series of measurements at increasing power levels) show the same thing, so it's kind of pointless to argue against this.
And regardless, AGAIN, if the t/s parameters shift enough to affect the response curve it will affect ANY alignment INCLUDING SEALED BOXES so this whole argument doesn't even really belong here.
I am afraid I have to disagree with some of this. T/S parameters are defined parameters, but it seems that often people who are critical of them try to pull them out of their definition, which changes everything. T/S parameters are defined under specific conditions, a "small signal" (very low drive level) is one of those conditions. A higher drive level may change the parameters considerably, but it's apples and oranges since that's not how the theory and math are defined. T/S parameters define something about the driver too, but I think that gets expanded beyond its intent as well. These parameters reveal how a driver behaves at its resonance, and then how that resonance is modified in a box. To this extent, it is very accurate and well-established. It doesn't tell you much more about a driver though. There are other measurements for that.
Regardless of how nice of a driver the original poster received, to treat T/S parameters as meaningless simply reveals a lack of understanding on the subject. It's like with crossovers - should we all be using textbook formulas or have we learned enough to move past that yet?
Now, about parameter changes with drive level, here's an interesting observation: Recently we were looking at some new woofers Dan Wiggins was designing. In order to see if they would work in our application I asked Dan to send me some specs. To my surprise I received a zipped folder of files that contained more data on each driver than I have ever seen before - lots of measurements, Kippel data, small signal, large signal, etc. Talk about data overload
I noticed that the small signal parameters and the large signal parameters were very different from each other, but I also noticed that the ones that increased and the ones that decreased where used in opposing terms in most of the formulas. So, I modeled the woofer in the same vented box using both sets of data. Sure enough, even though the small signal parameters and large signal parameter differed by wide amounts the woofer's bass response modeled essentially identical for both. That's because what was causing one parameter to increase was the same thing causing another opposing parameter to decrease and they maintained a balance, which makes sense as long as the driver remains in its linear range. T/S math works just fine.
Jeff
This is not an uncommon viewpoint, it's been expressed many times by many people that know what they are talking about. And power compression measurements (a series of measurements at increasing power levels) show the same thing, so it's kind of pointless to argue against this.
And regardless, AGAIN, if the t/s parameters shift enough to affect the response curve it will affect ANY alignment INCLUDING SEALED BOXES so this whole argument doesn't even really belong here.
]I need two t/s measurements of a single driver, one done at low power (millivolts) and one done at moderate power (say 10 watts or under) to sim and see how the frequency response changes.
Which is essentially what you have… the factory kit measures at much higher levels than mine. The differences in T/S are primarily due to differences in levels used to measure the T/S.
dave
Forgot to add the link, here it is - T/S Parameters, does everyone go by them? - Techtalk Speaker Building, Audio, Video Discussion Forum
Which is essentially what you have… the factory kit measures at much higher levels than mine. The differences in T/S are primarily due to differences in levels used to measure the T/S.
dave
I don't care Dave, these are two different drivers measured under different conditions with different equipment by different people in different parts of the world at different times, probably not even from the same production run. This info is useless.
Refer to the quoted post by Jeff Bagby above. Argue with his logic if you like, what he is saying is true, what you are saying is either untrue or completely overblown and exaggerated, as proven by power compression measurements.
Last edited:
I don't care Dave, these are two different drivers measured under different conditions with different equipment by different people in different parts of the world at different times, probably not even from the same production run.
While it is true that they are measured under different conditions, in different places, they are the same driver. The original point was to bring light to people dissing factory numbers.
The 1st 2 are the situation we all face here, but we usually are measuring different drivers.
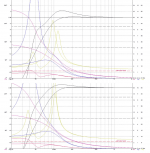
Since you can't seem to get it thru your head that the measures are for the same individual driver, i have attached is a 1st pass sim. With my measures it takes 40 litres to get a sealed box Q of 0.8 (top graph). With Mark's 10 litres. The other sim is 13L vented (something we have built many of and know work very well). I fiddled with the tuning to get the nicest shape i could (i know how to loose the bump in the curve using Mark's number).
dave
dave
Attachments
My measures and Mark's are (essentially) for the same driver. Use the data. Quit making lame excuses.
The reason I can't get it through my head is because you said it's ESSENTIALLY the same driver, not the same driver.
Unless he measured it and mailed it to you it's not the same driver. Probably not the same production run, and subject to probably 10 - 20 percent natural consistency variation.
And measured by two different sets of equipment under completely different conditions. THIS IS USELESS DATA for what I want to do, which is exactly what Bagby described doing.
If you have measured thousands of drivers and over 200 of this exact model of driver and you have measured some of the same exact individual driver several times why can't you just give me what I'm asking for instead of this data of two completely different (essentially the same, lol) drivers?
If this issue of drifting t/s parameters was as prominent as you say I'm sure you would have done comparisons to show the effect and you should have the data I'm asking for onhand for just this purpose. The sims you posted above just show natural t/s consistency variance in drivers from different production runs, not t/s parameter shift due to differing drive levels in the same driver.
But as Bagby (and many others) say, and as compression measurements show, this drifting in and out of tune simply is not an issue.
Last edited:
I measured many, choose a very closely matched pair and mailed the pair to Mark. I say essentially because i don't know which of the pair he measured. My data is for the average of the closely matched pair (near identical T/S), Mark's is for a single driver from the pair.
For the FE127 the unit-to-unit variation is on the order of plus/minus 15%.
This has nothing to do with power compression.
dave
For the FE127 the unit-to-unit variation is on the order of plus/minus 15%.
This has nothing to do with power compression.
dave
This has nothing to do with power compression.
dave
Neither do the compression sweeps until the power level gets quite high.
Compression sweeps are simply measurements at varying power levels from very low to very high charted on the same graph, and in data-bass measurements there's also a separate chart for compression losses that shows only the difference in losses.
These compression sweeps would be ideal for showing this change in response due to drifting t/s parameters, but they show nothing much until you get into power compression levels of power.
Regardless, I do not accept your driver data as acceptable for this exercise. There's not much left to say about that.
Compression sweeps and Bagby's quoted post pretty much put this issue to bed with more than enough evidence that the "drifting in and out of tune" concept is simply not true, especially at moderate power levels and regardless of dynamics. The most you see is about 1 - 2 db of compression (NOT drifting of tuning or significantly different response curve shape) until you get up around and past the driver's rated power handling.
For planet10 - your example doesn't really have much to do with significant changes in parameters causing frequency response changes at different powers. Your data is not sufficient to make a case yea or nay.
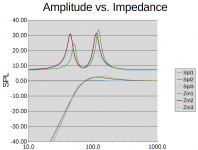
A graph of your three parameter sets. I designed a roughly maximally flat box (didn't run any numbers, just off the top of my head used 12 liters and 70Hz tune) using the factory specs, then used the other two sets in the same box.
1st set, your specs
2nd set, the LEAP specs
3rd set, factory.
Note very little difference between yours and mark's, mostly less than a dB. Then note the factory...
Attachments
Olsen and Benson were getting close. But not quite close enough.
You probably mean Beranek, not Benson. Beranek was very close, even mentioned neglecting radiation resistance. Novak actually did it, then Thiele came around with his alignments paper that spit out the 0.383 number that gets so often repeated.
Benson arguably did more than Thiele or Small, except in a couple small areas.
IMO, He didn't get published outside australia because his papers were too exhaustive, too long.
A Neville Thiele wrote an obituary in the JAES.
http://www.aes.org/aeshc/docs/jaes.obit/JAES_V38_3_PG197.pdf
Last edited:
Recent posters sound like medieval monks arguing about insubstantial concepts. What I want to know is WHAT physical aspect of the shaking-cardboard driver isn't behaving nicely. With that information, the hardware folks can get to work addressing the problem. Beats me why anybody in the world would think some stiff fabric and a roll of rubber makes a perfect spring.
Maybe a couple of extra fudge-factors could be added to today's favourite model, like Einstein did once (in error). Even guesses are welcome.
(For sure, arguing that luckily errors counter-balance is a kind of going-to-ground logic that leads nowhere except lets sim advocates with no curiosity sleep better at night.)
Ben
Last edited:
You probably mean Beranek, not Benson. Beranek was very close, even mentioned neglecting radiation resistance. Novak actually did it, then Thiele came around with his alignments paper that spit out the 0.383 number that gets so often repeated.
Benson arguably did more than Thiele or Small, except in a couple small areas.
IMO, He didn't get published outside australia because his papers were too exhaustive, too long.
A Neville Thiele wrote an obituary in the JAES.
http://www.aes.org/aeshc/docs/jaes.obit/JAES_V38_3_PG197.pdf
Yep.
To much dust that far back in the brain!
Have you stopped to look at compression measurements ranging from very low power level to ragged edge of destruction high power level?
If you had you would see that the small signal model is quite effective at predicting the response curve right up to very high power levels. It isn't until you approach and exceed the power rating of the driver that you start to get significant (+3 db) changes in the frequency response curve.
ANthony.
All I ever see from you are simulations.
Please post some of your own measured examples of what you are trying to discuss.
Otherwise all you are doing is ******* into the wind. And it's coming straight back on you buddy.
Beats me why anybody in the world would think some stiff fabric and a roll of rubber makes a perfect spring.
Nobody does.
Beats me why anybody in the world would think some stiff fabric and a roll of rubber makes a perfect spring.
They are the cheapest solution to a problem.
They can be bettered.
And I'm working on exactly that.
R & D
Sometimes it even pays off in the long run.
ANthony.
All I ever see from you are simulations.
You haven't been paying attention then. I posted measurements of stuff I designed and built as recently as a few weeks ago.
Besides, isn't this a bit hypocritical? Where are your contributions?
Please post some of your own measured examples of what you are trying to discuss.
Otherwise all you are doing is ******* into the wind. And it's coming straight back on you buddy.
I've provided more evidence to support my case than anyone arguing with me has. I posted the very important Bagby quote which settles the matter, and I advised taking at look at data-bass compression sweeps several times. These compression sweeps also prove there is no "drifting in and out of tune" at moderate power levels.
As far as I'm concerned I've proven my case beyond any shadow of doubt. If you have some measurements that contradict my evidence go ahead and post it.
I'll amend my comment to simulations and quotes from other peoples work.
Any way.
Same old stuff.
You are right and every one else needs to see your wisdom.
Get's old really fast.
Any way.
Same old stuff.
You are right and every one else needs to see your wisdom.
Get's old really fast.
- Status
- Not open for further replies.
- Home
- Loudspeakers
- Subwoofers
- Impedance chart, need explanation