I would not used any of these small drivers below 400-500Hz..Glad I have them - now have to figure a box worthy of them..
..for hifi!I would not used any of these small drivers below 400-500Hz..
really? why?I would not used any of these small drivers below 400-500Hz..
This is 10WB measurements, 10F is not same driver..
Really?
https://www.hifisound.de/en/Do-it-yourself-Products/Speaker-Drivers/SCAN-SPEAK-10-WB-0824G00-10F-8424G00.html
i like the pro sound forums that require you to post under your real name prevents a lot of bad behavior and b.s.
Wintermute,
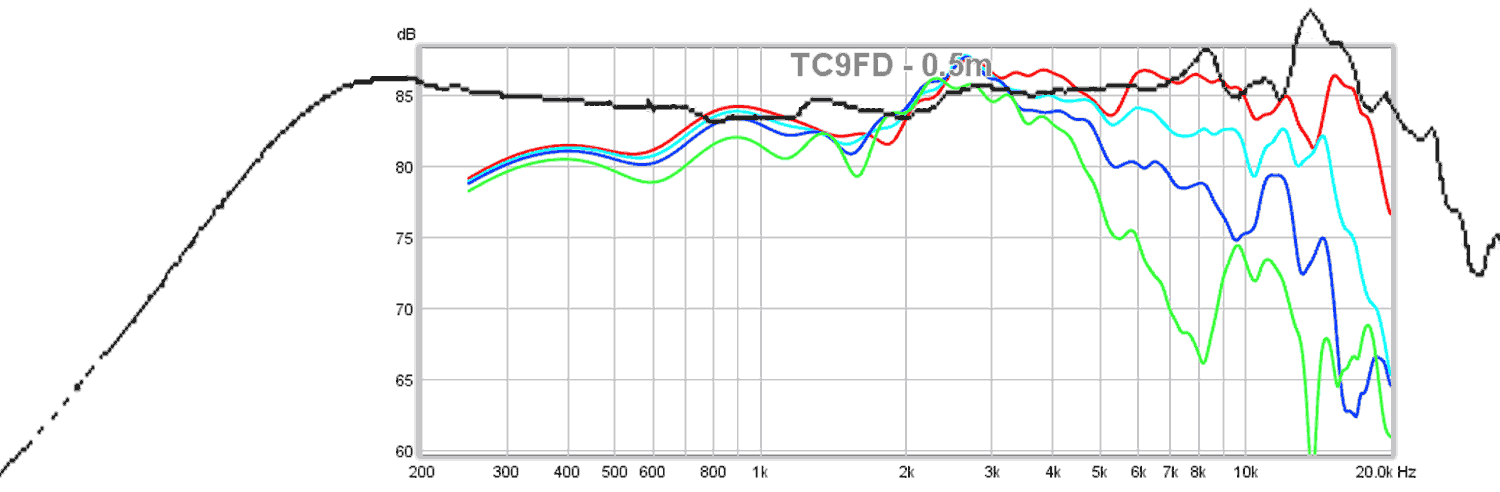
I will happy to post my TC9FD REW file for 0 deg case. Hopefully it fits under size upload limit - might have to put .asc extension on it. I get vocal when p10 continually keeps making erroneous comparisons based on photoshop scaling without including axis and tickmarks of original data. You know the term "photoshopping" means to distort the truth or not portray the truth from an original image. That is exactly what is happening here. Without a reference coordinate system, you can photoshop any result you wish. I am just defending my data when this keeps happening. Count how many times p10 has photoshopped data vs his own real data. Zero real data so far from him for frequency response.
X I am disappointed with this response. it is exactly the type of response that is just going to keep this argument going. The problem is your insinuation that P10 is deliberately trying to mislead people. This is the same thing that has caused all the hoo ha in the first place (the assertion not even insinuation) by some people that MA data is false and deliberately deceiving.
I will upload the splcopy traced zaph TC9FD18 FRD file, and also the one I did from the MA CHN70 datasheet. If you wish to upload your measurements as well then anyone can download them and do their own comparisons.
I'll put together a post on my own experience of drivers not measuring like the manufacturers datasheet showed a bit later. I spent a lot of time trying to work out why, but in the end I just accepted it, and built my speakers, and have been very happy with the result!
From my perspective, you and P10 have an issue with one another. You both have your fans in the forum for different reasons. If the two of you keep going at each other then the fallout affects MANY more people. I would ask (again in a non mod capacity) that you BOTH take your differences off line if you can't get past them. I was trying to be subtle in my first message.
I would also request that the fan's stay out of it as well!
I respect BOTH XRK and P10. That is why I am torn about what to do in this situation, and also why I am choosing to address this in a non-moderator way, appealing for you both to realize what your disagreement is doing to the general harmony of the forum.
The attached frd's were traced using nth technologies spl copy, and then minimum phase extracted using the Phase extractor spreadsheet. I've also put a plot of the zaph measurement of the TC9 overlayed on the traced factory CHN70. I'm not going to offer any interpretation of it. It is just there to show how the two files can be loaded into a program and compared. I did scale the spl to get the two to overlay each other.
Tony.
Attachments
Your scaling is wrong, once again.
I'll check, but if you are looking it is hard to not get the graticles to line up. I have been careful since i made that first mistake -- factory 20 lined up with XRK 200 Hz.(the lowest graticle on each lined up).
dave
Your scaling is wrong, once again.
Here it is again. I scaled your graph to Zaph's this time. No changes to either file but the scaling on yours. No cleanup. And no vertical translation (done on previous graphs to minimize differences.
You can see how the gratical line up?
dave
Attachments
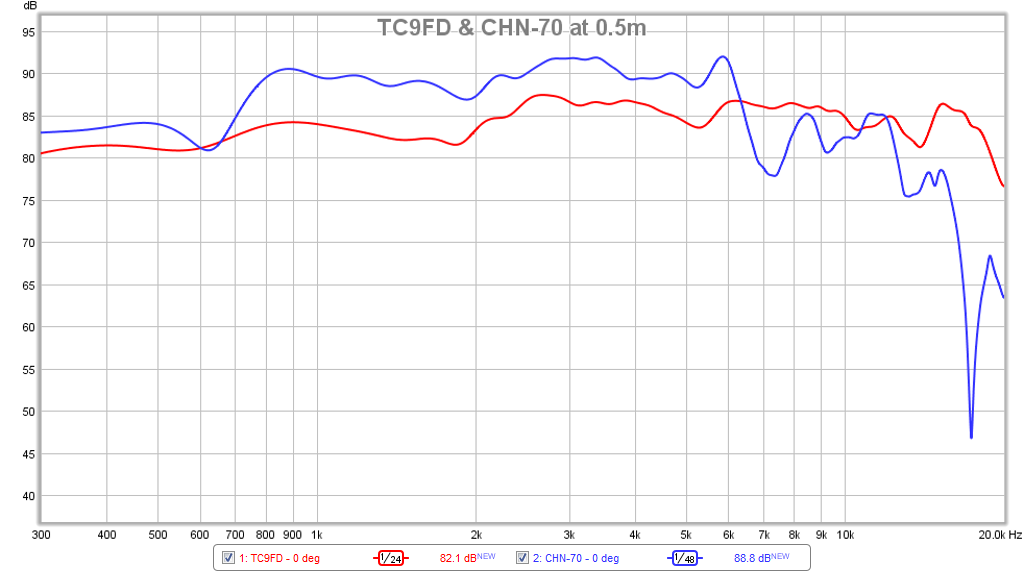
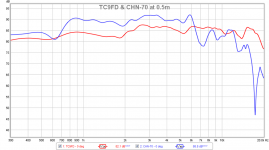
Measurement .frd files for TC9FD and CHN-70
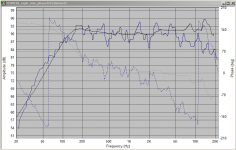
Data was taken at 0.5m distance from driver at 0 deg (on axis). Driver centerline is 39in above floor. First reflection is at 6ms, data should be "gated" or windowed 4ms after pulse and 1ms before pulse. Everything above 400Hz is probably OK. 1/48th octave smoothing. Excitation voltage was approximately 0.7 volts RMS.
The key features of the plateau (600Hz to 6kHz) present on my data and the Japanese website data, appears to be missing from the MA factory data that Wintermute - re-plotted properly on an expanded scale. That actually looks good and I would buy/use a driver that measures like that.
.frd files have .txt extension in order to be uploaded, rename to .frd for use in popular programs.
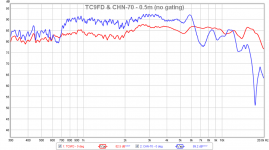
Here is the same data without narrow gating (actually 100ms before and 500ms after):

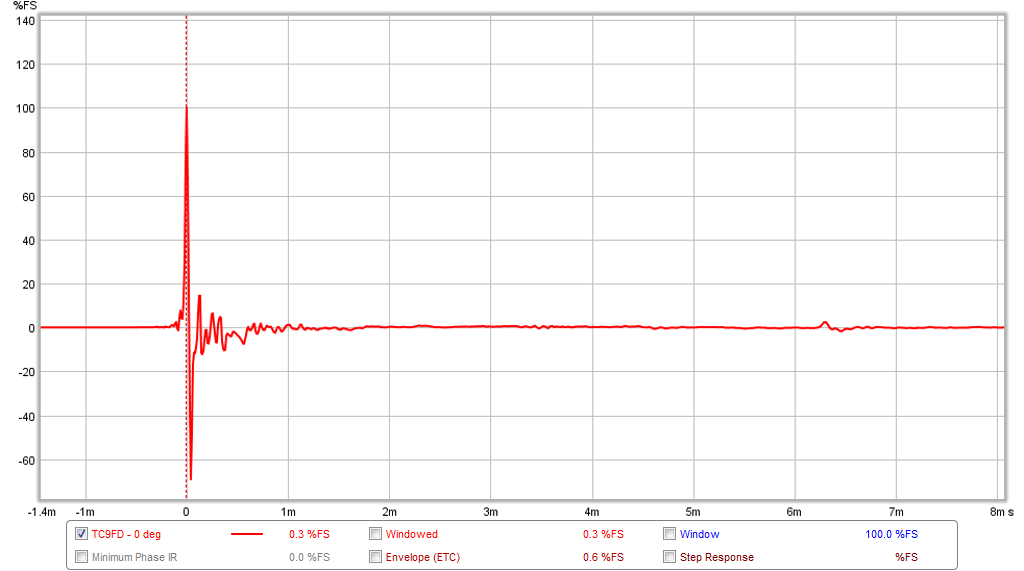
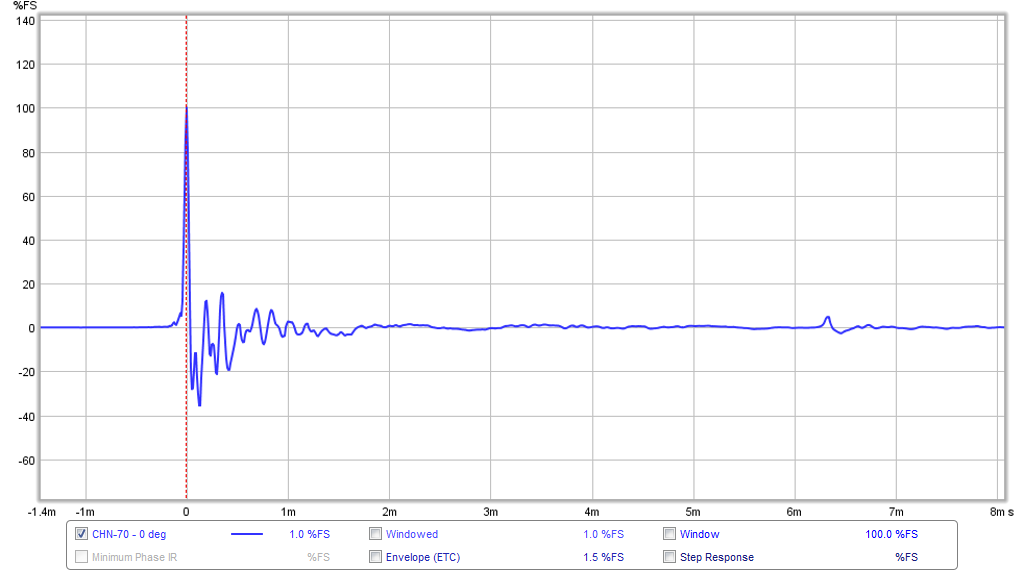
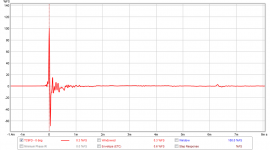
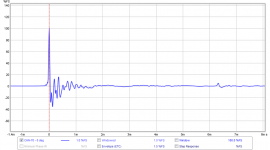
Here is the impulse response for each so you can see that the first reflection is at 6ms.
Data was taken at 0.5m distance from driver at 0 deg (on axis). Driver centerline is 39in above floor. First reflection is at 6ms, data should be "gated" or windowed 4ms after pulse and 1ms before pulse. Everything above 400Hz is probably OK. 1/48th octave smoothing. Excitation voltage was approximately 0.7 volts RMS.
The key features of the plateau (600Hz to 6kHz) present on my data and the Japanese website data, appears to be missing from the MA factory data that Wintermute - re-plotted properly on an expanded scale. That actually looks good and I would buy/use a driver that measures like that.
.frd files have .txt extension in order to be uploaded, rename to .frd for use in popular programs.
Here is the same data without narrow gating (actually 100ms before and 500ms after):
Here is the impulse response for each so you can see that the first reflection is at 6ms.
Attachments
Last edited:
you really need to stop scaling stuff via photoshop - how accurate do you think that is, especially given the fact that you don't show tickmarks for the data that you scaled from?
Within the accuracy of the original images (which are VERY high for the factory graphs i can pull out of the spec sheets as vector files).
They are scaled based on lining up the graticles (tickmarks) and then removing one set to clean things up.
But having done the 2nd Zaph one up, i think i like that one better. Less work. But lower rez.
If you want to have an objective debate with quantitative data, either take your own (you have a TC9FD) or get the real data files from Zaph or whoever you feel like quoting in your quest to debunk the XRK data.just please stop photoshop scaling other people's plots - not accurate and not useful!
The point is to check up the veracity of statements you have used to justify the statements about how close your data is to factory, and to Zaph's after 5th Element's comment. I am taking existing data brought up in the discussion and putting it in a format where they can properly be compared.
I will keep creating these so that members can make their own evaluation.
That you think i am cheating to make you look bad is sad and not the case at all.
dave
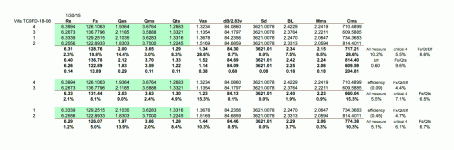
Test a bunch of these and you will notice they are very close in performance to each other
I only have 4. After 300-400 low level break-in, they got measured for matching. The 4 were not that close.
dave
Attachments
Thank you Tony. The post above yours is exceedingly alarming for the FR forum, and I gather it is far from being an isolated example. Not good at all.
Count me in the same camp as RajkoM Scottmoose.
Is the MA frequency chart accurate or not? Is it possible some measure this flat and some don't due to manufacturing variations? is the MA chart real or not?
- Home
- Loudspeakers
- Full Range
- Vifa TC9FD18-08 best bang for the buck